
Mathematics, 13.12.2021 07:10 aidenmanpig
POSSIBLE POINTS 33 33
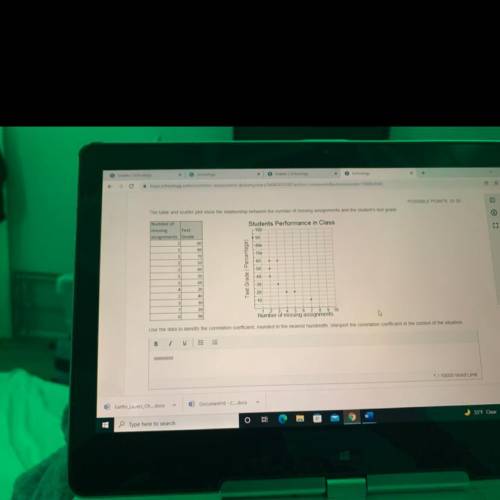
The table and scatter plot show the relationship between the number of missing assignments and the student's test grade
Students Performance in Class
100
90
-80-
-70
-60
Number of
missing
Test
assignments Grade
2
60
1
80
1
70
2 50
2
60
5
20
3
60
4
20
2
40
3 30
7
20
0
90
Test Grade (Percentage)
50
-40
30
20
10
1 3 4 5 6 7 8 10
Number of missing assignments
Use the data to identify the correlation coefficient, rounded to the nearest hundredth. Interpret the correlation coefficient in the context of the situation,
B
1
IC
iii
TII

Answers: 3


Another question on Mathematics
Mathematics, 21.06.2019 17:40
Which basic geometric term has no width, no length, and no thickness? line b. point c. angle d. plane
Answers: 2
Mathematics, 21.06.2019 18:30
Which of the choices shown could be used to prove that aacp=abcp ?
Answers: 1
Mathematics, 21.06.2019 22:00
To decrease an amount by 16% what single multiplier would you use
Answers: 1
Mathematics, 22.06.2019 00:00
Titus works at a hotel. part of his job is to keep the complimentary pitcher of water at least half full and always with ice. when he starts his shift, the water level shows 4 gallons, or 128 cups of water. as the shift progresses, he records the level of the water every 10 minutes. after 2 hours, he uses a regression calculator to compute an equation for the decrease in water. his equation is w –0.414t + 129.549, where t is the number of minutes and w is the level of water. according to the equation, after about how many minutes would the water level be less than or equal to 64 cups?
Answers: 2
You know the right answer?
POSSIBLE POINTS 33 33
The table and scatter plot show the relationship between the number of missi...
Questions


Mathematics, 05.09.2019 04:30
Mathematics, 05.09.2019 04:30

Chemistry, 05.09.2019 04:30


English, 05.09.2019 04:30

Social Studies, 05.09.2019 04:30
Mathematics, 05.09.2019 04:30
Mathematics, 05.09.2019 04:30


