
Mathematics, 13.12.2021 07:20 oliviahopebigel
POSSIBLE POINTS 33 33
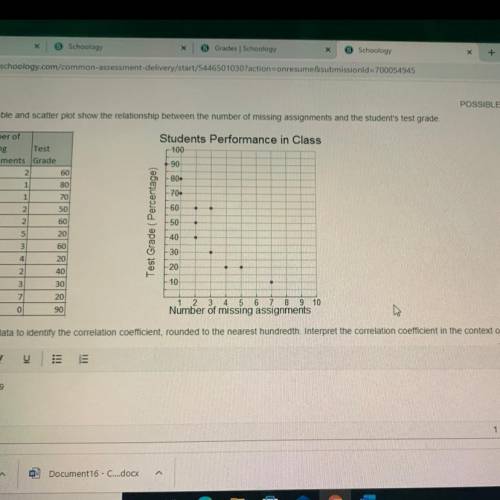
The table and scatter plot show the relationship between the number of missing assignments and the student's test grade
Students Performance in Class
100
90
-80-
-70
-60
Number of
missing
Test
assignments Grade
2
60
1
80
1
70
2 50
2
60
5
20
3
60
4
20
2
40
3 30
7
20
0
90
Test Grade (Percentage)
50
-40
30
20
10
1 3 4 5 6 7 8 10
Number of missing assignments
Use the data to identify the correlation coefficient, rounded to the nearest hundredth. Interpret the correlation coefficient in the context of the situation,
B
1
IC
iii
TII

Answers: 1


Another question on Mathematics
Mathematics, 21.06.2019 17:30
The manufacturer of a new product developed the following expression to predict the monthly profit, in thousands of dollars, from sales of the productwhen it is sold at a unit price of x dollars.-0.5x^2 + 22x - 224what is represented by the zero(s) of the expression? a.the profit when the unit price is equal to 0b.the unit price(s) when the profit is equal to 0c.the profit when the unit price is greatestd.the unit price(s) when profit is greatest
Answers: 3
Mathematics, 21.06.2019 18:40
Aportion of a hiking trail slopes downward at about an 84° angle. to the nearest tenth of a flot, what is the value of x, the distance the hiker traveled along the path, if he has traveled a horizontal distance of 120 feet? a. 143.3 b. 12.5 c. 120.7 d. 130.2
Answers: 1
You know the right answer?
POSSIBLE POINTS 33 33
The table and scatter plot show the relationship between the number of missi...
Questions


Chemistry, 10.03.2020 18:46
Mathematics, 10.03.2020 18:46


Physics, 10.03.2020 18:46

Mathematics, 10.03.2020 18:47

Computers and Technology, 10.03.2020 18:47
Mathematics, 10.03.2020 18:47


