
Mathematics, 15.12.2021 04:50 Hrjohnson2004
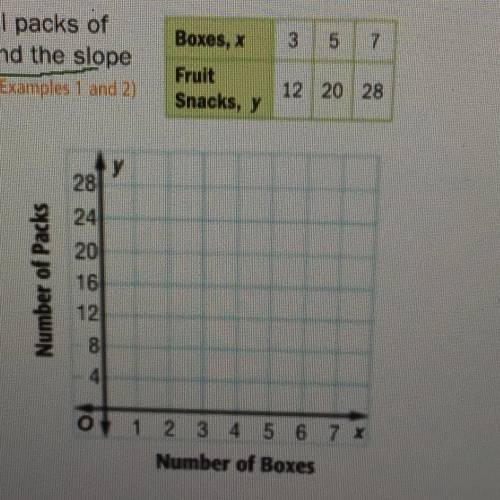
The table at the right shows the number of small packs of fruit snacks y per box x. Graph the data then find the slope of the line. Explain what the slope represents

Answers: 2


Another question on Mathematics
Mathematics, 21.06.2019 15:00
Which is the correct excel formula for the 80th percentile of a distribution that is n(475, 33)? =norm.dist(80,475,33,1) =norm.inv(0.80,475,33) =norm.s.inv((80-475)/33)?
Answers: 1
Mathematics, 21.06.2019 21:00
Evaluate 5 + 6 · 2 – 8 ÷ 4 + 7 using the correct order of operations. a. 22 b. 11 c. 27 d. 5
Answers: 1
You know the right answer?
The table at the right shows the number of small packs of fruit snacks y per box x. Graph the data t...
Questions
Mathematics, 20.08.2020 09:01
Mathematics, 20.08.2020 09:01

Biology, 20.08.2020 09:01

Computers and Technology, 20.08.2020 09:01

Physics, 20.08.2020 09:01

English, 20.08.2020 09:01

Social Studies, 20.08.2020 09:01
Mathematics, 20.08.2020 09:01

Chemistry, 20.08.2020 09:01
Mathematics, 20.08.2020 09:01
English, 20.08.2020 09:01
Mathematics, 20.08.2020 09:01
Mathematics, 20.08.2020 09:01
Computers and Technology, 20.08.2020 09:01
Social Studies, 20.08.2020 09:01
Biology, 20.08.2020 09:01

Arts, 20.08.2020 09:01
Mathematics, 20.08.2020 09:01
Mathematics, 20.08.2020 09:01


