
Mathematics, 15.12.2021 21:40 JamesLachoneus
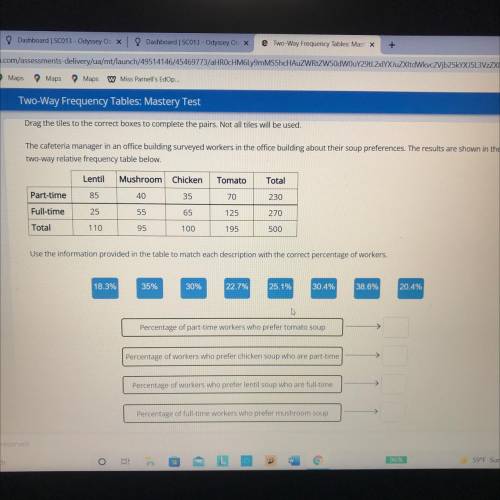
Drag the tiles to the correct boxes to complete the pairs. Not all tiles will be used.
The cafeteria manager in an office building surveyed workers in the office building about their soup preferences. The results are shown in the
two-way relative frequency table below.
Lentil
Mushroom Chicken
Tomato
Total
85
40
35
70
230
Part-time
Full-time
25
55
65
125
270
Total
110
95
100
195
500
Use the information provided in the table to match each description with the correct percentage of workers.
18.3%
35%
30%
22.7%
25.1%
30.4%
38.6%
20.4%
Percentage of part-time workers who prefer tomato soup
>
Percentage of workers who prefer chicken soup who are part-time
>
Percentage of workers who prefer lentil soup who are full-time
Percentage of full-time workers who prefer mushroom soup

Answers: 2


Another question on Mathematics
Mathematics, 21.06.2019 17:30
Is it true or false i’m trying to pass this test so i can leave school
Answers: 2
Mathematics, 21.06.2019 22:00
15 points what is the end behavior of this graph? & what is the asymptote of this graph?
Answers: 1
Mathematics, 22.06.2019 03:00
Ben frank is an electrician who installs lighting fixtures. he charges (in dollars) his clients 15h+40f15h+40f where hh is the number of hours worked and ff is the number of fixtures installed. how much does ben frank charge when he works 77 hours and installs 99 fixtures?
Answers: 1
Mathematics, 22.06.2019 03:30
Determine the equivalent system for the given system of equations: 5x − 3y = 6 x + y = 2
Answers: 3
You know the right answer?
Drag the tiles to the correct boxes to complete the pairs. Not all tiles will be used.
The cafeter...
Questions

History, 05.03.2021 07:50


Social Studies, 05.03.2021 07:50
Mathematics, 05.03.2021 07:50
Mathematics, 05.03.2021 07:50
Mathematics, 05.03.2021 07:50
Mathematics, 05.03.2021 07:50
Mathematics, 05.03.2021 07:50
Mathematics, 05.03.2021 07:50
Mathematics, 05.03.2021 07:50
Mathematics, 05.03.2021 07:50
Mathematics, 05.03.2021 07:50


