
Mathematics, 17.12.2021 02:40 maleah12x
Analyze the graph below to identify the key features of the logarithmic function.
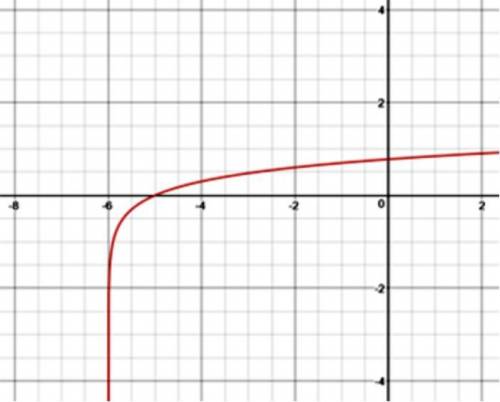
Graph begins in the third quadrant near the line x equals negative 6 and increases rapidly while crossing the ordered pair negative 5, 0. The graph then begins to increase slowly throughout the second and first quadrants.
The x‐intercept is x = −5, and the graph approaches a vertical asymptote at x = −6.
The x‐intercept is y = −5, and the graph approaches a vertical asymptote at y = −6.
The x‐intercept is x = 5, and the graph approaches a vertical asymptote at x = 6.
The x‐intercept is y = 5, and the graph approaches a vertical asymptote at y = 6.

Answers: 3


Another question on Mathematics
Mathematics, 21.06.2019 20:30
The graph of y x3 is translated so that the point (1. 1) is moved to (1, 4). what is the equation of the new graph?
Answers: 1
Mathematics, 21.06.2019 20:40
The acceleration of an object due to gravity is 32 feet per second squared.what is acceleration due to gravity in inches per second squared?
Answers: 2
Mathematics, 21.06.2019 21:00
X+y=-4 x-y=2 use elimination with adding and subtraction
Answers: 3
Mathematics, 21.06.2019 21:00
The? half-life of a radioactive substance is 20 years. if you start with some amount of this? substance, what fraction will remain in 120 ? years
Answers: 1
You know the right answer?
Analyze the graph below to identify the key features of the logarithmic function.
Graph begins in...
Questions
Mathematics, 17.02.2021 23:40
Mathematics, 17.02.2021 23:40
Mathematics, 17.02.2021 23:40
Mathematics, 17.02.2021 23:40

Arts, 17.02.2021 23:40
Mathematics, 17.02.2021 23:40

Mathematics, 17.02.2021 23:40

Business, 17.02.2021 23:40

Biology, 17.02.2021 23:40

Mathematics, 17.02.2021 23:40
Mathematics, 17.02.2021 23:40

Mathematics, 17.02.2021 23:40
Mathematics, 17.02.2021 23:40

Mathematics, 17.02.2021 23:40


