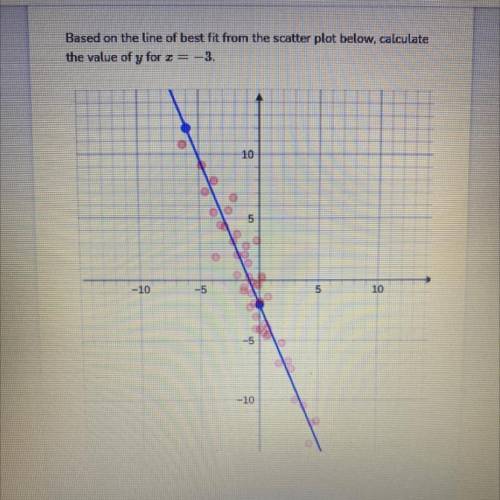
Based on the line of best fit from the scatter plot below, calculate
the value of y for r= -3....

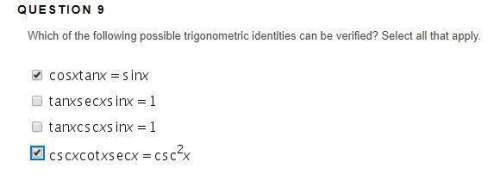
Mathematics, 19.12.2021 08:50 Rosebud5605
Based on the line of best fit from the scatter plot below, calculate
the value of y for r= -3.

Answers: 3


Another question on Mathematics
Mathematics, 21.06.2019 15:30
Which equation represents the line that passes through the points and (4, 10) and (2, 7)? y = 3/2x - 11y = 3/2x +4y = - 3/2x + 19y = - 3/2x + 16
Answers: 2
Mathematics, 21.06.2019 19:40
The weights of broilers (commercially raised chickens) are approximately normally distributed with mean 1387 grams and standard deviation 161 grams. what is the probability that a randomly selected broiler weighs more than 1,425 grams?
Answers: 2
Mathematics, 21.06.2019 22:20
In a young single person's monthly budget, $150 is spent on food, $175 is spent on housing, and $175 is spend on other items. suppose you drew a circle graph to represent this information, what percent of the graph represents housing?
Answers: 1
You know the right answer?
Questions


Social Studies, 15.04.2021 21:30
Mathematics, 15.04.2021 21:30
Mathematics, 15.04.2021 21:30


Physics, 15.04.2021 21:30


