
Mathematics, 08.01.2022 02:20 samirahscott
70 Points to whoever answers this and is right.
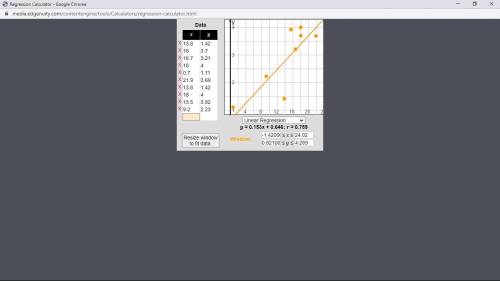
⦁ Using the regression calculator in your tool bar, create a scatterplot using your data set from step 1. Insert a screenshot of your scatterplot, or recreate it below.
Step 3: Analyze your data.
Now that you have represented your data graphically, it can be more easily analyzed.
⦁ Describe how the line of best fit and the correlation coefficient can be used to determine the correlation between the two variables on your graph.
⦁ Describe the type of correlation between the two variables on your graph. How do you know?
⦁ Does the correlation between the variables imply causation? Explain.
⦁ How do you calculate the residuals for a scatterplot?
⦁ Calculate the residuals for your scatterplot in step 2d.
⦁ Create a residual plot for your data.
⦁ Does your residual plot show that the linear model from the regression calculator is a good model? Explain your reasoning.
Step 4: Make a prediction with your data.
⦁ Using your equation from step 2d, estimate the GPA of a student who studies for 15 hours a week. Justify your answer.

Answers: 2


Another question on Mathematics
Mathematics, 21.06.2019 18:00
Asquare has a perimeter of sixteen centimeters. what is the length of each of its sides? a. 8 cm c. 9 cm b. 4 cm d. 10 cm select the best answer from the choices
Answers: 2
Mathematics, 22.06.2019 02:00
Point a is at 12, and point d is at 56. point c is midway between a and d, and point b is midway between a and c. which of these is the coordinate of b?
Answers: 3
You know the right answer?
70 Points to whoever answers this and is right.
⦁ Using the regression calculator in your tool bar...
Questions
Mathematics, 09.11.2019 18:31
Mathematics, 09.11.2019 18:31

Mathematics, 09.11.2019 18:31
History, 09.11.2019 18:31

Mathematics, 09.11.2019 18:31

Physics, 09.11.2019 18:31


French, 09.11.2019 18:31

Arts, 09.11.2019 18:31
Social Studies, 09.11.2019 18:31
Mathematics, 09.11.2019 18:31

Chemistry, 09.11.2019 18:31


