
Mathematics, 10.01.2022 20:00 Bleejones00
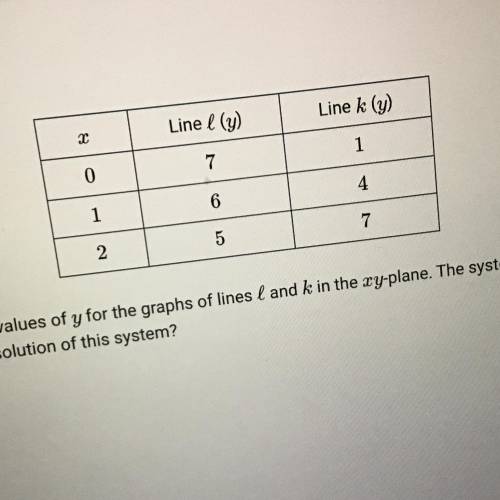
The table gives some values of and the corresponding values of y for the graphs of lines and in the ry plane The system of equations consisting of the equations for and
khas solution (2) What is the ordered pair that is the solution of this system?
А
(1.-2)
B
(0.5,6,5)
с
(1.5,5,6)
D
(3.10)

Answers: 2


Another question on Mathematics
Mathematics, 21.06.2019 18:30
For this option, you will work individually. the pythagorean theorem can be used in many real-world scenarios. part 1 write your own real-world scenario where the pythagorean theorem can be applied to find a missing piece. you may choose to write a problem that is two- or three-dimensional in nature. be sure that you will be able to draw a diagram of your scenario. write out your problem and submit it for part 1. be sure to end your scenario with a question. part 2 draw a diagram of the scenario you created in part 1. you may draw by hand and scan and upload your drawing or create a computer-generated drawing for submission. be sure to label all parts and dimensions of the drawing. part 3 solve the question that you posed in part 1. show all of your steps in answering the question. for this option, you will need to submit all three parts for full credit—your real-world problem and question, the diagram that you created, and your work solving the problem, showing all steps. * note that your instructor is looking for your own original idea. while it is acceptable to use the internet for research and inspiration, academic integrity policies apply.
Answers: 1
Mathematics, 21.06.2019 23:00
Graph the system of equations. {6x−4y=−244x−8y=−32 use the line tool to graph the lines.
Answers: 1
Mathematics, 22.06.2019 02:00
1. the manager of collins import autos believes the number of cars sold in a day (q) depends on two factors: (1) the number of hours the dealership is open (h) and (2) the number of salespersons working that day (s). after collecting data for two months (53 days), the manager estimates the following log-linear model: q 4 equation 1 a. explain, how to transform the log-linear model into linear form that can be estimated using multiple regression analysis. the computer output for the multiple regression analysis is shown below: q4 table b. how do you interpret coefficients b and c? if the dealership increases the number of salespersons by 20%, what will be the percentage increase in daily sales? c. test the overall model for statistical significance at the 5% significance level. d. what percent of the total variation in daily auto sales is explained by this equation? what could you suggest to increase this percentage? e. test the intercept for statistical significance at the 5% level of significance. if h and s both equal 0, are sales expected to be 0? explain why or why not? f. test the estimated coefficient b for statistical significance. if the dealership decreases its hours of operation by 10%, what is the expected impact on daily sales?
Answers: 2
You know the right answer?
The table gives some values of and the corresponding values of y for the graphs of lines and in the...
Questions

Chemistry, 11.05.2021 02:00

Biology, 11.05.2021 02:00

Social Studies, 11.05.2021 02:00

Mathematics, 11.05.2021 02:00
Social Studies, 11.05.2021 02:00
Mathematics, 11.05.2021 02:00
Social Studies, 11.05.2021 02:00

Chemistry, 11.05.2021 02:00
Mathematics, 11.05.2021 02:00


