
Mathematics, 17.01.2022 14:00 reginapokorny
The deflection temperature under load for two different types of plastic pipe is
being investigated. Two random samples of 15 pipe specimens are tested, and the
deflection temperatures observed are as follows (in Fahrenheit ):
Type 1: 206 188 205 191 194 193 207 185 189 213 192 210 194 198 205
Type 2: 177 197 206 200 180 176 185 200 197 192 198 188 189 203 192
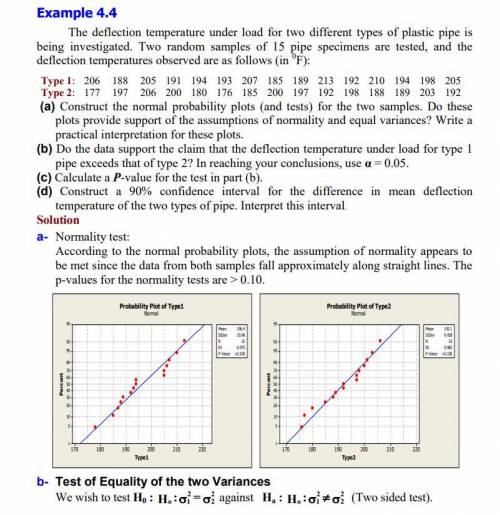
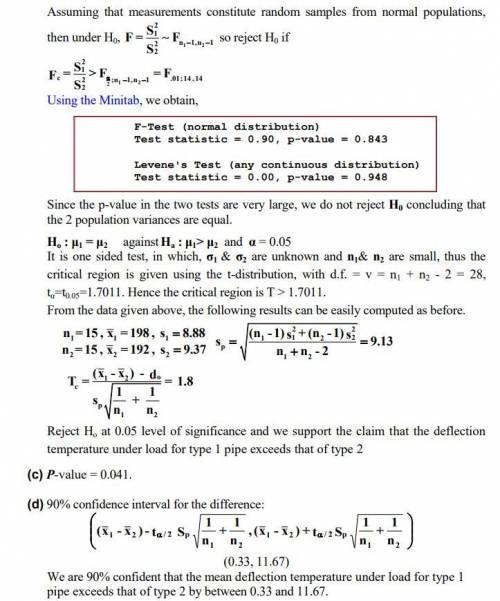
(a) Construct the normal probability plots (and tests) for the two samples. Do these
plots provide support for the assumptions of normality and equal variances? Write a
practical interpretation for these plots.
(b) Do the data support the claim that the deflection temperature under load for type 1
pipe exceeds that of type 2? In reaching your conclusions, use α = 0.05.
(c) Calculate a P-value for the test in part (b).
(d) Construct a 90% confidence interval for the difference in mean deflection
temperature of the two types of pipe. Interpret this interval.
My question is: how (b) is the test of the two variances? I don't understand this point

Answers: 2


Another question on Mathematics
Mathematics, 21.06.2019 20:30
In the diagram of circle o, what is the measure of zabc?
Answers: 2
Mathematics, 21.06.2019 22:00
(05.03 mc) part a: explain why the x-coordinates of the points where the graphs of the equations y = 4x and y = 2x−2 intersect are the solutions of the equation 4x = 2x−2. (4 points) part b: make tables to find the solution to 4x = 2x−2. take the integer values of x between −3 and 3. (4 points) part c: how can you solve the equation 4x = 2x−2 graphically? (2 points)
Answers: 1
Mathematics, 21.06.2019 22:30
Amachine that produces a special type of transistor (a component of computers) has a 2% defective rate. the production is considered a random process where each transistor is independent of the others. (a) what is the probability that the 10th transistor produced is the first with a defect? (b) what is the probability that the machine produces no defective transistors in a batch of 100? (c) on average, how many transistors would you expect to be produced before the first with a defect? what is the standard deviation? (d) another machine that also produces transistors has a 5% defective rate where each transistor is produced independent of the others. on average how many transistors would you expect to be produced with this machine before the first with a defect? what is the standard deviation? (e) based on your answers to parts (c) and (d), how does increasing the probability of an event a↵ect the mean and standard deviation of the wait time until success?
Answers: 3
Mathematics, 22.06.2019 02:00
Pls what is the relative minimum of the function? enter your answer in the box
Answers: 3
You know the right answer?
The deflection temperature under load for two different types of plastic pipe is
being investigate...
Questions


Mathematics, 08.07.2019 18:30
History, 08.07.2019 18:30

History, 08.07.2019 18:30

English, 08.07.2019 18:30
Social Studies, 08.07.2019 18:30

Biology, 08.07.2019 18:30
Mathematics, 08.07.2019 18:30
History, 08.07.2019 18:30

Computers and Technology, 08.07.2019 18:30


