

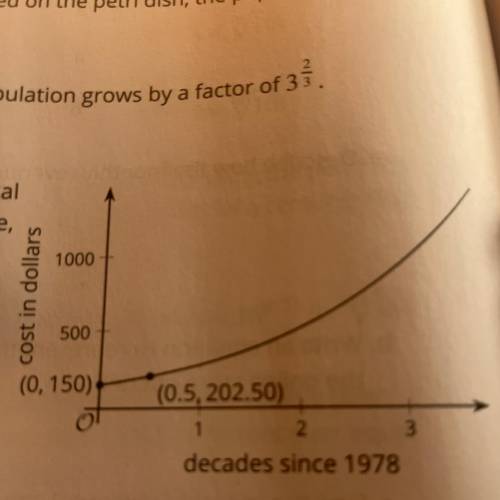
The graph represents the cost of a medical
treatment, in dollars, as a function of time,
d,...

Mathematics, 21.01.2022 08:50 elijaahstepp041
The graph represents the cost of a medical
treatment, in dollars, as a function of time,
d, in decades since 1978.
Find the cost of the treatment, in dollars,
when d = 1. Show your reasoning.

Answers: 3


Another question on Mathematics
Mathematics, 21.06.2019 14:30
Part a : solve - vp + 40 < 65 for v . part b : solve 7w - 3r = 15 for r show your work!
Answers: 1
Mathematics, 21.06.2019 18:30
The length of a rectangle is x times the square root of 100. the width is one-half y more than three-halves x. given that the area of the rectangle is 125 cm2, which equation could represent the rectangle in terms of x and y? a) 5xy − 15x = 125 b) 5xy + 15x = 125 c) 15x2 − 5xy = 125 d) 15x2 + 5xy = 125
Answers: 2
Mathematics, 21.06.2019 20:00
The function models the number of accidents per 50 million miles driven as a function
Answers: 1
You know the right answer?
Questions
Mathematics, 22.04.2020 03:33

History, 22.04.2020 03:33
History, 22.04.2020 03:33
History, 22.04.2020 03:33

Chemistry, 22.04.2020 03:33

Biology, 22.04.2020 03:33

English, 22.04.2020 03:33


History, 22.04.2020 03:33
Mathematics, 22.04.2020 03:34

Computers and Technology, 22.04.2020 03:34


