
Mathematics, 24.01.2022 03:00 ob3ymysins
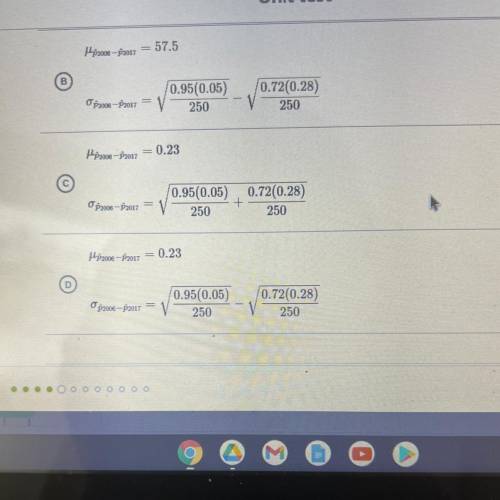
In 2006, 95% of new cars in the US came with a spare tire. In 2017, 72% came with a spare tire.
Suppose a researcher takes separate random samples of 250 cars made in each year, then looks at the
difference between the sample proportions P2006 - P2017 of cars with spare tires in each sample.
What are the mean and standard deviation of the sampling distribution of P2006 - P2017?
Choose 1
A. mean of P2006-P2017: 57.5
Standard Deviation of P2006-2017: Square root of .95(.05)/250 + .72(.28)/250
B C and D in picture

Answers: 3


Another question on Mathematics
Mathematics, 21.06.2019 19:00
What are the solutions of the system? solve by graphing. y = -x^2 -6x - 7 y = 2
Answers: 2
Mathematics, 21.06.2019 23:30
The legs of a right triangle measure 6 meters and 8 meters. what is the length of the hypotonuse.
Answers: 1
Mathematics, 21.06.2019 23:30
What is the explicit rule for the sequence in simplified form? −1,−4,−7,−10,−13… an=4−5n an=−4−3n an=2−3n an=−6−5n
Answers: 1
Mathematics, 21.06.2019 23:30
What are the coordinates of the image of p for a dilation with center (0, 0) and scale factor 2
Answers: 1
You know the right answer?
In 2006, 95% of new cars in the US came with a spare tire. In 2017, 72% came with a spare tire.
Su...
Questions


English, 05.09.2020 17:01

English, 05.09.2020 17:01
English, 05.09.2020 17:01

Chemistry, 05.09.2020 17:01


Law, 05.09.2020 17:01


