
Mathematics, 24.01.2022 09:30 nicollexo21
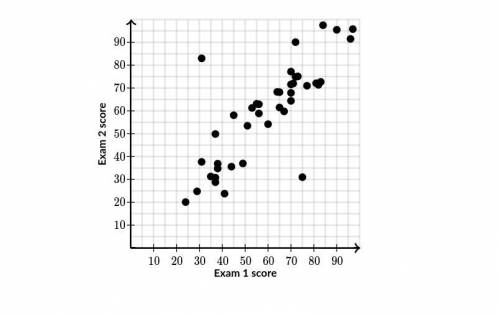
The plot shown below describes the relationship between students' scores on the first exam in a class and their corresponding scores on the second exam in the class.
Which of the following is the best estimate of the average change in the score on Exam 2 associated with a 1 point increase in the score on Exam 1?
Choose 1
(Choice A)
1/4 point
(Choice B)
1/2 point
(Choice C)
1 point
(Choice D)
2 points

Answers: 2


Another question on Mathematics
Mathematics, 22.06.2019 01:00
At a book fair, joe bought 24 books at 3 for $5 and had $2 left. how much money did he have at first?
Answers: 2
Mathematics, 22.06.2019 01:30
Andy has $310 in his account. each week, w, he withdraws $30 for his expenses. which expression could be used if he wanted to find out how much money he had left after 8 weeks?
Answers: 1
Mathematics, 22.06.2019 05:30
The probability brenda will recieve a telemarketing call is 15%. if she gets 20 calls a day, how many can she expect to be telemarketing calls ?
Answers: 1
Mathematics, 22.06.2019 06:00
What is the value of x? enter your answer in the box. x =
Answers: 1
You know the right answer?
The plot shown below describes the relationship between students' scores on the first exam in a clas...
Questions

Advanced Placement (AP), 01.07.2019 12:30
Mathematics, 01.07.2019 12:30
Mathematics, 01.07.2019 12:30

History, 01.07.2019 12:30
Mathematics, 01.07.2019 12:30

Chemistry, 01.07.2019 12:30

Biology, 01.07.2019 12:30


Mathematics, 01.07.2019 12:30


