
Mathematics, 31.01.2022 06:10 maxgeacryne5573
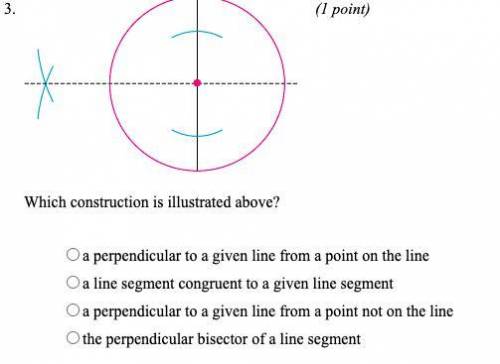
Which construction is illustrated above?
A) a perpendicular to a give line from a point on the line
B) a line segment congruent to a given line segment
C) a perpendicular to a given line from a point not on the line
D) the perpendicular bisector of a line segment

Answers: 1


Another question on Mathematics
Mathematics, 21.06.2019 22:30
Write the equation of a line that is perpendicular to the given line and that passes through the given point. –3x – 6y = 17; (6, 3) y = x – 9 y = 2x – 9 y = –2x – 9 y = x + 0 3. is the relationship shown by the data linear? if so, model the data with an equation. x y 1 5 5 10 9 15 13 20 the relationship is linear; y – 5 = (x – 1). the relationship is not linear. the relationship is linear; y – 5 = (x – 1). the relationship is linear; y – 1 = (x – 5). write an equation in point-slope form for the line through the given point with the given slope. (–10, –1); m = y + 10 = (x + 1) y – 1 = (x – 10) y – 1 = (x + 10) y + 1 = (x + 10) 5. write an equation for each translation of . 6.5 units up y + 6.5 = | x | y = | 6.5 x | y = | x | + 6.5 y = | x | – 6.5 6. write an equation for each translation of . 5.5 units right y = | x | + 5.5 y = | x – 5.5 | y = | x | – 5.5 y = | x + 5.5 | 7. which equation translates y = | x | by 8 units to the left? y = | x | – 8 y = | x | + 8 y = | x – 8| y = | x + 8|
Answers: 1
Mathematics, 22.06.2019 00:30
An unknown number x is at most 10. which graph best represents all the values of x? number line graph with closed circle on 10 and shading to the right. number line graph with open circle on 10 and shading to the right. number line graph with open circle on 10 and shading to the left. number line graph with closed circle on 10 and shading to the left.
Answers: 1
Mathematics, 22.06.2019 01:30
Given are five observations for two variables, x and y. xi 1 2 3 4 5 yi 3 7 5 11 14 which of the following is a scatter diagrams accurately represents the data? what does the scatter diagram developed in part (a) indicate about the relationship between the two variables? try to approximate the relationship betwen x and y by drawing a straight line through the data. which of the following is a scatter diagrams accurately represents the data? develop the estimated regression equation by computing the values of b 0 and b 1 using equations (14.6) and (14.7) (to 1 decimal). = + x use the estimated regression equation to predict the value of y when x = 4 (to 1 decimal). =
Answers: 3
You know the right answer?
Which construction is illustrated above?
A) a perpendicular to a give line from a point on the lin...
Questions

Chemistry, 12.09.2021 21:40

Mathematics, 12.09.2021 21:40
Mathematics, 12.09.2021 21:40
Mathematics, 12.09.2021 21:40

Business, 12.09.2021 21:40
Mathematics, 12.09.2021 21:40

English, 12.09.2021 21:40
Mathematics, 12.09.2021 21:40


English, 12.09.2021 21:40
Mathematics, 12.09.2021 21:40
Mathematics, 12.09.2021 21:40


