Hours of Homework

Mathematics, 08.02.2022 01:00 annie8348
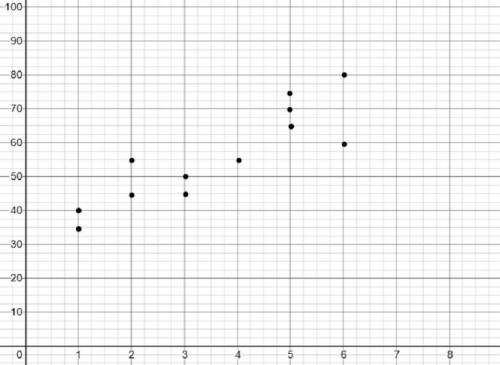
Consider this scatter plot.
Test Scores in Relation to Homework
Hours of Homework
(a) Is the relationship linear or not linear? Justify your response.
(b) Is the relationship increasing or decreasing? Find the slope and use it to help justify your answer.
(c) Paul uses the function y = 7x + 30 to model the situation. What score does Paul’s model predict for 3
hours of homework? Hint: It’s _not_ asking you to use the graph.
(d) Describe what the number 30 in Part (c) mean in the context of the situation? Hint: Think about what
kind of function equation you have in Part B.

Answers: 2


Another question on Mathematics
Mathematics, 21.06.2019 17:00
If a baby uses 15 diapers in 2 days, how many diapers will the baby use in a year?
Answers: 2
Mathematics, 22.06.2019 01:20
Write 5 in the form of a/b using integers to show it as a rational number
Answers: 1
Mathematics, 22.06.2019 04:40
Yasmin purchased 6 heads of cabbage that each weighed 2 3/8 pounds how much did the cabbage way all together
Answers: 1
You know the right answer?
Consider this scatter plot.
Test Scores in Relation to Homework
Hours of Homework
Hours of Homework
Questions
Mathematics, 15.01.2020 04:31

History, 15.01.2020 04:31

English, 15.01.2020 04:31
Mathematics, 15.01.2020 04:31
Mathematics, 15.01.2020 04:31
Mathematics, 15.01.2020 04:31

Advanced Placement (AP), 15.01.2020 04:31
English, 15.01.2020 04:31


Geography, 15.01.2020 04:31
English, 15.01.2020 04:31

Biology, 15.01.2020 04:31
Mathematics, 15.01.2020 04:31
Mathematics, 15.01.2020 04:31


