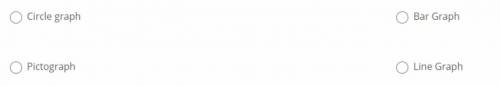
Which type of graph would be the most useful to show changes in a quantity over time?
...

Mathematics, 08.02.2022 14:00 Talber1
Which type of graph would be the most useful to show changes in a quantity over time?

Answers: 2


Another question on Mathematics
Mathematics, 21.06.2019 14:00
Jackie bought a bag of oranges. she used 3/8 of the oranges to make orange juice. she used 1/3 of the oranges to make a fruit salad. she put 1/8 of the oranges in a bowl on the table. she put 2/12 of the oranges in the refrigerator. a) jackie left more oranges on the table than she put in the refrigerator. b) jackie used fewer oranges to make orange juice than she left on the table. c) jackie put fewer oranges in the refrigerator than she used to make the fruit salad. eliminate d) jackie used more oranges to make a fruit salad than she used to make orange juice.
Answers: 1
Mathematics, 21.06.2019 17:00
The general form of the quetion of a circle is ax^2+by^2+cx+dy+e=0 where a=b=0 if the circle has a radius of three units and the center lies on the y axis which set of values of a, b, c, d, and e might correspond to the circle
Answers: 1
Mathematics, 21.06.2019 18:30
Players on the school soccer team are selling candles to raise money for an upcoming trip. each player has 24 candles to sell. if a player sells 4 candles a profit of$30 is made. if he sells 12 candles a profit of $70 is made. determine an equation to model his situation?
Answers: 3
Mathematics, 21.06.2019 19:20
Find the area of an equilateral triangle with a side of 6 inches
Answers: 2
You know the right answer?
Questions

History, 24.10.2021 20:00
Mathematics, 24.10.2021 20:00
Mathematics, 24.10.2021 20:00

Mathematics, 24.10.2021 20:00

Mathematics, 24.10.2021 20:00

Health, 24.10.2021 20:00
Mathematics, 24.10.2021 20:00
Mathematics, 24.10.2021 20:00
Mathematics, 24.10.2021 20:00

Biology, 24.10.2021 20:00


