
Mathematics, 12.02.2022 07:20 ecolifesfsu1263
Collect data from several fast-food chains on the number of fat calories and grams of saturated fat in menu items. A record at least 12 ordered pairs of (fat calories, grams of saturated fat). Organize your data in a table.
II. Make a scatter plot of the data on graph paper. Be sure to label the axes and use an appropriate title for the graph.
You may wish to use a graphing calculator, spread sheet, or other technology resource (such as the graphing utility link below) to aid you in graphing.
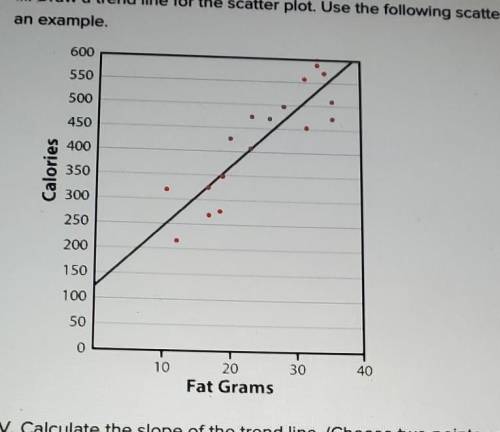
III. Draw a trend line for the scatter plot. Use the following scatter plot of the ordered pairs (fat grams, total calories) as an example.
IV. Calculate the slope of the trend line. (Choose two points on the line and find vertical change over horizontal change.)
Note: Graphing calculators and spread sheets have features with which to draw trend lines and determine the equation. You may choose to use one of these options. If you use technology, indicate what steps were taken to arrive at your equation.
V. Using the slope and y-intercept, write the equation of the trend line (y=mx+b).
VI. Choose a calories from fat value that is not in your collected data set and this is at least 10 fat calories away from any collected value. Use the equation calculated in step V to predict the number of fat grams in an item haveing that number of fat calories. Be sure to show your work.
VII. search for an item in a fast food menu having the same number of fat calories as the one you chose above . (if you cannot find the exact value ,get as close as u can.) Compare the calculated value frome step VI to this actual value. explain why or why not u would have expected your prediction calculated value to be closevto the actual value.

Answers: 2


Another question on Mathematics
Mathematics, 21.06.2019 12:30
Autility company burns coal to generate electricity. the cost c(p), (in dollars) of removing p percent of the some stack pollutants is given by c(p)= 85000p/100-p a) find the cost to remove 30% of the pollutant b) find where the function is undefined
Answers: 3
Mathematics, 21.06.2019 17:50
Eric has challenged himself to walk 24,000 steps in 4 days. if eric walks the same number of steps each day, which function represents the number of steps eric still needs to walk to reach his goal with respect to the number of days since he started his challenge? a. y = 8,000x − 24,000 b. y = -8,000x + 24,000 c. y = 6,000x − 24,000 d. y = -6,000x + 24,000
Answers: 1
Mathematics, 21.06.2019 19:30
Agroup of randomly selected apple valley high school students were asked to pick their favorite gym class. the table below shows the results of the survey. there are 528 students at apple valley high school. gym class number of students racquet sports 1 team sports 9 track and field 17 bowling 13 based on the data, what is the most reasonable estimate for the number of students at apple valley high school whose favorite gym class is bowling? choose 1 answer a. 9 b. 13 c. 119 d. 172
Answers: 1
You know the right answer?
Collect data from several fast-food chains on the number of fat calories and grams of saturated fat...
Questions

Mathematics, 12.02.2021 23:40

Chemistry, 12.02.2021 23:40
Mathematics, 12.02.2021 23:40


Biology, 12.02.2021 23:40
Mathematics, 12.02.2021 23:40

Social Studies, 12.02.2021 23:40

English, 12.02.2021 23:40
Mathematics, 12.02.2021 23:40
Mathematics, 12.02.2021 23:40


