
Mathematics, 16.02.2022 21:10 Masonb1849
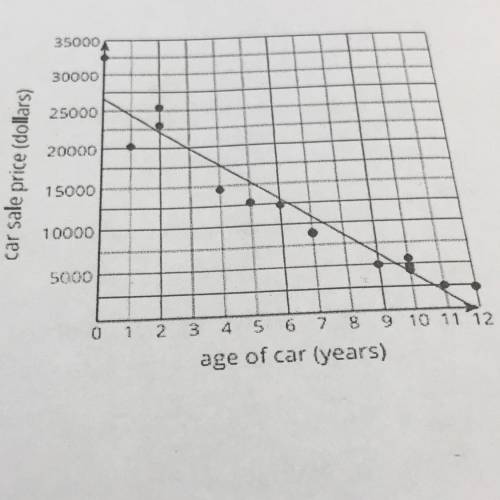
3. A local car salesperson created a scatter plot to display the
relationship between a car's sale price in dollars, y, and the age of
the carin years, x. The equation of the line that models the data in
the scatter plot is given by y = -2500x + 26000. This equation is
shown in the scatter plot.
a. where in the equation do you see the slope? what does it represent?
b. where in the graph do you see the y-intercept?what does it represent?
c. ava said the slope of the line -2500 and that it describes the rate at which the age of the car is decreasing. why is she inccorrect?
d. danielle explained that the older cars are more expensive? do you dissagree or agree?

Answers: 3


Another question on Mathematics
Mathematics, 21.06.2019 16:00
You eat 8 strawberries and your friend eats 12 strawberries from a bowl. there are 20 strawberries left. which equation and solution give the original number of strawberries?
Answers: 3
Mathematics, 21.06.2019 19:00
Identify the conclusion of the conditional statement. if you live in phoenix, then you live in arizona.
Answers: 1
You know the right answer?
3. A local car salesperson created a scatter plot to display the
relationship between a car's sale...
Questions


Computers and Technology, 06.07.2020 22:01


Computers and Technology, 06.07.2020 22:01
Health, 06.07.2020 22:01


