
Mathematics, 22.02.2022 19:10 kyleeeeee94
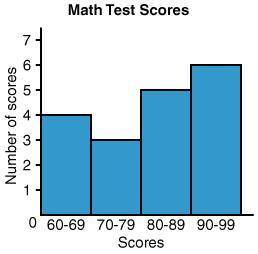
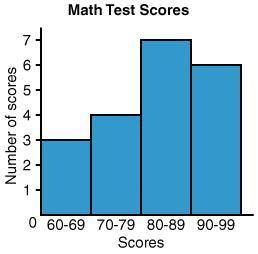
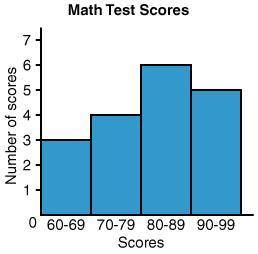
Mr. Jacobs is going to make a histogram of the test scores from the last math test he gave. He plans to first organize the data into a stem-and-leaf plot and then make the histogram from the stem-and-leaf plot. The test scores are listed below.
79, 82, 65, 61, 94, 97, 84, 77, 89, 91, 90, 83, 99, 71, 68, 77, 87, 85
Which of the following histograms represents this data?
Thank you!

Answers: 1


Another question on Mathematics
Mathematics, 21.06.2019 17:30
Scrub a dub toothbrushes are $4.00 each. there is a 10% discount, but there is also a 6% sales tax after the discount is applied. what is the new price after tax? round to the nearest penny
Answers: 1
Mathematics, 21.06.2019 23:20
8litres of paint can cover 129.6 m². how much paint is required to paint an area of 243m²?
Answers: 3
Mathematics, 22.06.2019 00:10
If sr is 4.5cm and tr is 3cm, what is the measure in degrees of angle s? a. 56.3 b. 33.7 c. 41.8 d. 48.2
Answers: 3
You know the right answer?
Mr. Jacobs is going to make a histogram of the test scores from the last math test he gave. He plans...
Questions


Mathematics, 18.10.2019 01:20
Mathematics, 18.10.2019 01:20
Mathematics, 18.10.2019 01:20
Mathematics, 18.10.2019 01:20

English, 18.10.2019 01:20

Mathematics, 18.10.2019 01:20
Mathematics, 18.10.2019 01:20
Mathematics, 18.10.2019 01:20
Mathematics, 18.10.2019 01:20


