
Mathematics, 06.03.2022 20:10 andrew5632
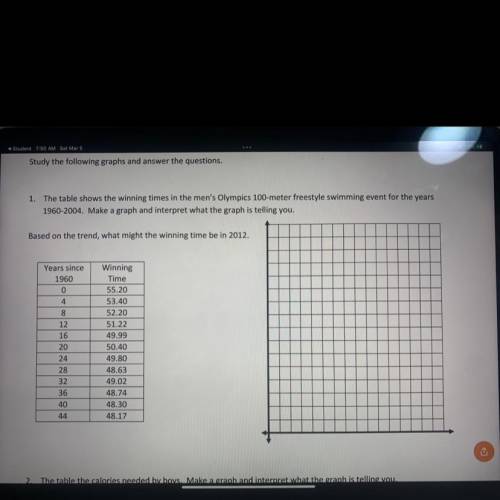
1. The table shows the winning times in the men's Olympics 100-
meter freestyle swimming event for the years
1960-2004. Make a graph and interpret what the graph is telling you.
Based on the trend, what might the winning time be in 2012.
Years since
1960
0
4
8
12
16
Winning
Time
55.20
53.40
52.20
51.22
49.99
50.40
49.80
48.63
49.02
48.74
48.30
48.17
20
24
28
32
36
40
44

Answers: 1


Another question on Mathematics
Mathematics, 21.06.2019 17:00
Simone claims the initial value and y-intercept are the same thing on a graph. is she correct? if you know that a line has a slope of and a y-intercept of 7, what is the equation for that line in slope-intercept form?
Answers: 1
Mathematics, 21.06.2019 20:00
Pepe and leo deposits money into their savings account at the end of the month the table shows the account balances. if there pattern of savings continue and neither earns interest nor withdraw any of the money , how will the balance compare after a very long time ?
Answers: 1
Mathematics, 21.06.2019 21:00
If u good at math hit me up on insta or sum @basic_jaiden or @ and
Answers: 1
You know the right answer?
1. The table shows the winning times in the men's Olympics 100-
meter freestyle swimming event for...
Questions
Mathematics, 08.11.2021 14:00
Mathematics, 08.11.2021 14:00

History, 08.11.2021 14:00

Mathematics, 08.11.2021 14:00

English, 08.11.2021 14:00
Mathematics, 08.11.2021 14:00
Mathematics, 08.11.2021 14:00
Mathematics, 08.11.2021 14:00
Mathematics, 08.11.2021 14:00

Mathematics, 08.11.2021 14:00
Mathematics, 08.11.2021 14:00


