
Mathematics, 13.03.2022 16:50 enchantednights
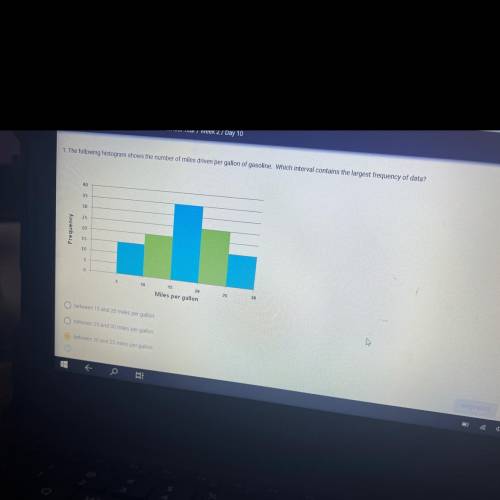
1. The following histogram shows the number of miles driven per gallon of gasoline. Which interval contains the largest frequency of data?
40
35
30
25
20
Frequency
15
10
5
10
15
20
25
30
Miles per gallon

Answers: 1


Another question on Mathematics
Mathematics, 21.06.2019 18:00
Yesterday i ran 5 miles. today, i ran 3.7 miles. did my percent increase, decrease or is it a percent error? plz i need
Answers: 2
Mathematics, 21.06.2019 20:00
The art class is planning to paint a mural on an outside wall. this figure is a scale drawing of the wall. width: 11 in length: 28 in unit rate: 1.5 ft per in. write the ratio of the area of the drawing to the area of the actual mural. write your answer as a unit rate. show that this unit rate is equal to the square of the unit rate 1.5 ft per in
Answers: 1
Mathematics, 21.06.2019 23:00
Which graph represents the linear function below? y-3=1/2(x+2)
Answers: 2
Mathematics, 22.06.2019 01:30
Five friends found a dollar on the ground and decided they each should get 1/5 of it. what amount of money will each friend get? $0.05 $0.20 $0.30 $0.80
Answers: 2
You know the right answer?
1. The following histogram shows the number of miles driven per gallon of gasoline. Which interval c...
Questions

Social Studies, 20.10.2019 18:20

History, 20.10.2019 18:20
History, 20.10.2019 18:20

Physics, 20.10.2019 18:20
Mathematics, 20.10.2019 18:20
Mathematics, 20.10.2019 18:20


English, 20.10.2019 18:20
Social Studies, 20.10.2019 18:20

English, 20.10.2019 18:20
Mathematics, 20.10.2019 18:20
History, 20.10.2019 18:30
Mathematics, 20.10.2019 18:30
Mathematics, 20.10.2019 18:30


