
Mathematics, 15.03.2022 07:00 thaliavernazaa
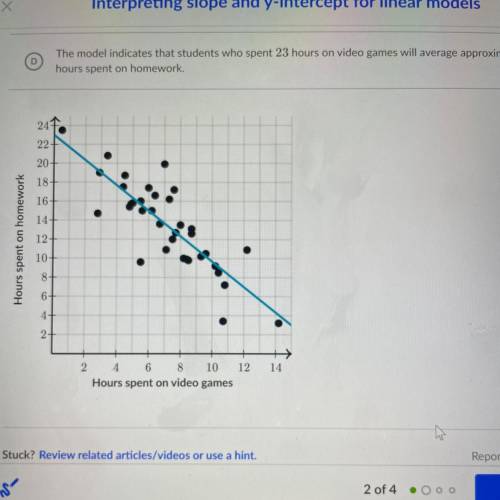
The graph shows the relationship between hours spent on video games and hours spent on homework last week
for students in Joyce's class. Joyce created the following scatterplot and regression line to show this relationship.
The fitted line has a y-intercept of 23.
What is the best interpretation of this y-intercept?
Choose 1
A
The model indicates that students who spent 0 hours on video games will average 23 hours spent
on homework.
Joyce spent approximately 23 hours on homework.
Joyce spent approximately 23 hours on video games.
The model indicates that students who spent 23 hours on video games will average approximately 0
hours spent on homework.
21

Answers: 1


Another question on Mathematics
Mathematics, 21.06.2019 17:00
You have $600,000 saved for retirement. your account earns 5.5% interest. how much, to the nearest dollar, will you be able to pull out each month, if you want to be able to take withdrawals for 20 years?
Answers: 1
Mathematics, 21.06.2019 22:30
If a and −a are numbers on the number line, which expression must give the distance between them? a) 0 b) a c) |2a| d) |a|
Answers: 1
Mathematics, 22.06.2019 00:30
42. if 20 men can eat 200 kg of wheat in 40 days, then 10 men can eat 300 kg of wheat in how many days? a) 120 days b) 60 days c) 80 days d) none of these
Answers: 1
You know the right answer?
The graph shows the relationship between hours spent on video games and hours spent on homework last...
Questions

World Languages, 11.09.2020 21:01
Mathematics, 11.09.2020 21:01
Mathematics, 11.09.2020 21:01
Mathematics, 11.09.2020 21:01

Arts, 11.09.2020 21:01
Mathematics, 11.09.2020 21:01
Mathematics, 11.09.2020 21:01

Chemistry, 11.09.2020 21:01
Mathematics, 11.09.2020 21:01
Chemistry, 11.09.2020 21:01
Mathematics, 11.09.2020 21:01
Mathematics, 11.09.2020 21:01
Mathematics, 11.09.2020 21:01
Mathematics, 11.09.2020 21:01
Mathematics, 11.09.2020 21:01
Mathematics, 11.09.2020 21:01
Mathematics, 11.09.2020 21:01
Mathematics, 11.09.2020 21:01

Social Studies, 11.09.2020 21:01
Mathematics, 11.09.2020 21:01


