
Mathematics, 16.03.2022 08:40 jakhunter354
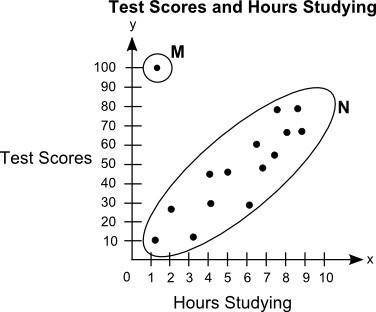
The scatter plot shows the relationship between the test scores of a group of students and the number of hours they study in a week:
Part A: What is the group of points labeled N called? What is the point labeled M called? Give a possible reason for the presence of point M. (5 points)
Part B: Describe the association between students' test scores and the number of hours they study. (5 points)

Answers: 1


Another question on Mathematics
Mathematics, 21.06.2019 20:30
For g(x) = 5x - 3 and h(x) = [tex]\sqrt{x}[/tex], find (g · h)(4)
Answers: 1
Mathematics, 21.06.2019 22:00
What is the solution to the equation e3x=12? round your answer to the nearest hundredth
Answers: 1
Mathematics, 22.06.2019 00:00
The amount cami raised during last year’s charity walk, $45.50, is 7/10 of the amount she raised this year. which equation represents n, the number of dollars she raised this year?
Answers: 2
Mathematics, 22.06.2019 02:00
The table below shows the number of free throw shots attempted and the number of shots made for the five starting players on the basketball team during practice. each player's goal is to make 80% of her shots.
Answers: 1
You know the right answer?
The scatter plot shows the relationship between the test scores of a group of students and the numbe...
Questions
Mathematics, 26.09.2019 22:30

History, 26.09.2019 22:30
Mathematics, 26.09.2019 22:30

Biology, 26.09.2019 22:30
Biology, 26.09.2019 22:30
History, 26.09.2019 22:30

Chemistry, 26.09.2019 22:30

Mathematics, 26.09.2019 22:30

Computers and Technology, 26.09.2019 22:30
Biology, 26.09.2019 22:30

English, 26.09.2019 22:30
History, 26.09.2019 22:30


