
Mathematics, 12.07.2019 06:00 idioticeinstein9021
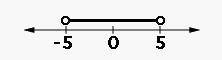
Select the graph that would represent the best presentation of the solution set for |x| < 5.

Answers: 1


Another question on Mathematics
Mathematics, 21.06.2019 16:00
Which is the graph of the piecewise function f(x)? f(x)=[tex]f(x) = \left \{ {{-x+1, x\leq 0 } \atop {x+1, x\ \textgreater \ 0}} \right.[/tex]
Answers: 3
Mathematics, 21.06.2019 17:00
The magnitude, m, of an earthquake is defined to be m=log l/s, where i is the intensity of the earthquake (measured by the amplitude of the seismograph wave) and s is the intensity of a “standard” earthquake, which is barely detectable. what is the magnitude of an earthquake that is 1,000 times more intense than a standard earthquake? use a calculator. round your answer to the nearest tenth.
Answers: 1
Mathematics, 21.06.2019 18:30
Jamie went to home depot.she bought 25 bags of soil that cost $9 per bag.she bought 15 pots at $8 each,and she bought 23 bags of pebbles at $15 each.she used a coupon that gave her $5 off for every 100 dollars she spent.how much did jame pay at the end?
Answers: 1
Mathematics, 21.06.2019 19:30
Aproduction manager test 10 toothbrushes and finds that their mean lifetime is 450 hours. she then design sales package of this type of toothbrush. it states that the customers can expect the toothbrush to last approximately 460 hours. this is an example of what phase of inferential statistics
Answers: 1
You know the right answer?
Select the graph that would represent the best presentation of the solution set for |x| < 5....
Questions
Mathematics, 22.01.2021 22:20

English, 22.01.2021 22:20

Chemistry, 22.01.2021 22:20


History, 22.01.2021 22:20
Mathematics, 22.01.2021 22:20
Mathematics, 22.01.2021 22:20
Mathematics, 22.01.2021 22:20
Chemistry, 22.01.2021 22:20


