
Mathematics, 17.07.2019 06:40 Bryoh
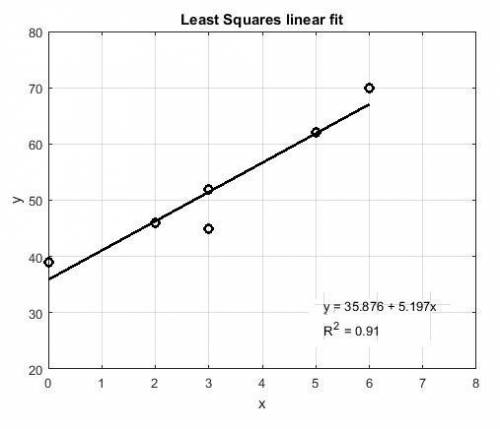
Find the equation of the regression line for the given data. then construct a scatter plot of the data and draw the regression line. (the pair of variables have a significant correlation.) then use the regression equation to predict the value of y for each of the given x-values, if meaningful. the number of hours 6 students spent for a test and their scores on that test are shown below. x 0 2 3 3 5 6 y 39 46 52 45 62 70

Answers: 1


Another question on Mathematics
Mathematics, 21.06.2019 15:00
Mindy bought 5/8 pound of almonds and a 3/4 pound of walnuts.which pair of fraction cannot be used to find how many pounds of nuts she bought in all.
Answers: 2
Mathematics, 21.06.2019 19:00
Me with geometry ! in this figure, bc is a perpendicular bisects of kj. dm is the angle bisects of bdj. what is the measure of bdm? •60° •90° •30° •45°
Answers: 2
Mathematics, 21.06.2019 21:10
What is the domain of the given function? {(3,-2), (6, 1), (-1, 4), (5,9), (-4, 0); o {x | x= -4,-1, 3, 5, 6} o {yl y = -2,0, 1,4,9} o {x|x = -4,-2, -1,0, 1, 3, 4, 5, 6, 9} o y y = 4,-2, -1, 0, 1, 3, 4, 5, 6, 9}
Answers: 1
You know the right answer?
Find the equation of the regression line for the given data. then construct a scatter plot of the da...
Questions


Advanced Placement (AP), 01.10.2019 04:00

Chemistry, 01.10.2019 04:00
Chemistry, 01.10.2019 04:00

Mathematics, 01.10.2019 04:00


History, 01.10.2019 04:00


Spanish, 01.10.2019 04:00

Mathematics, 01.10.2019 04:00
Mathematics, 01.10.2019 04:00


