
Mathematics, 20.07.2019 07:20 jeffcarpenter
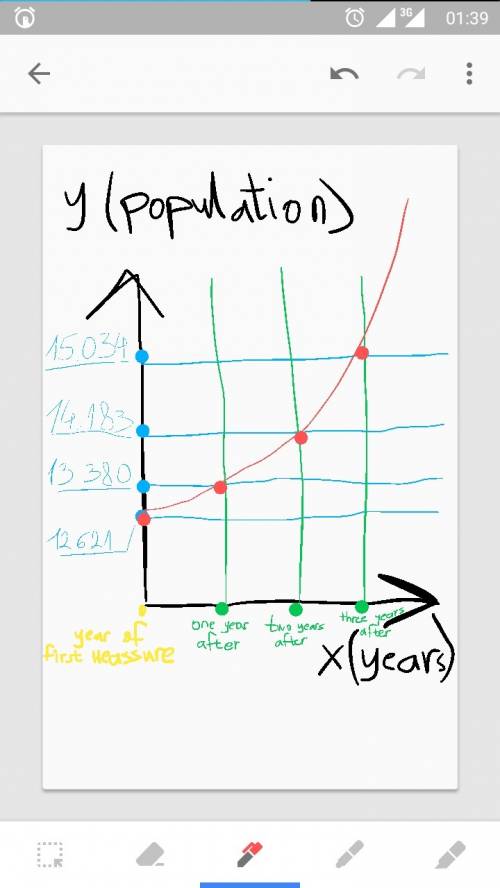
The first time a census was taken in esinville, the population was 12,621. each year after that, the population was about 6% higher than it was the previous year. sketch the graph that represents the situation. let x represent the number of years since the first census was taken. what are the coordinates of the point that contains the y-intercept? although answers are nice, i need step by step to me understand how to solve this. its exponential growth i believe?

Answers: 1


Another question on Mathematics
Mathematics, 21.06.2019 17:20
If you are just building your payment history, how many points from a perfect score will you possibly miss?
Answers: 1
Mathematics, 21.06.2019 18:30
Anew shopping mall is gaining in popularity. every day since it opened, the number of shoppers is 5% more than the number of shoppers the day before. the total number of shoppers over the first 10 days is 1258 how many shoppers were on the first day?
Answers: 2
Mathematics, 21.06.2019 22:30
Gabrielle's age is two times mikhail's age. the sum of their ages is 84. what is mikhail's age?
Answers: 2
Mathematics, 22.06.2019 02:40
Benefit(s) from large economies of scale, in which the costs of goods decrease as output increases. natural monopolles perfect competition
Answers: 1
You know the right answer?
The first time a census was taken in esinville, the population was 12,621. each year after that, the...
Questions
Mathematics, 23.08.2019 06:20

History, 23.08.2019 06:20
Mathematics, 23.08.2019 06:20

Chemistry, 23.08.2019 06:20

English, 23.08.2019 06:20

Mathematics, 23.08.2019 06:20
Mathematics, 23.08.2019 06:20

Geography, 23.08.2019 06:20


Chemistry, 23.08.2019 06:20


