
Mathematics, 20.07.2019 08:10 caggh345
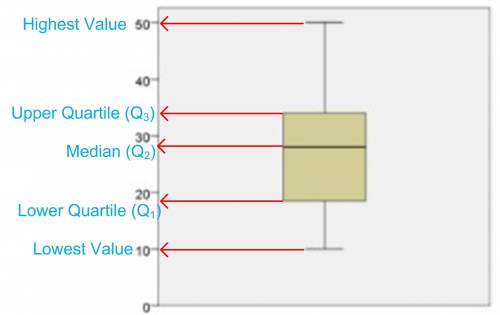
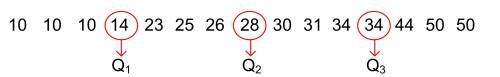
Which data set is represented by the box plot below? a. 10, 10, 10, 14, 23, 25, 26, 28, 30, 31, 34, 34, 44, 50, 50 b. 10, 10, 11, 12, 14, 18, 18, 18, 19, 20, 22, 26, 36, 42, 50 c. 10, 14, 18, 18, 19, 22, 31, 32, 33, 34, 40, 42, 43, 46, 50 d. 10, 14, 17, 24, 27, 32, 34, 34, 37, 38, 39, 39, 40, 43, 50

Answers: 1


Another question on Mathematics
Mathematics, 21.06.2019 15:30
Which answer is the solution set to the inequality |x|< 9? a. x< -9 or x> 9 b. x> -9 and x< 9 c. x> -9 or x< 9 d. x< 9 and x< 9
Answers: 1
Mathematics, 21.06.2019 15:40
Two parallel lines are crossed by a transversal. what is the value of x? x = 40 x = 70 x = 110 x = 130
Answers: 2
Mathematics, 21.06.2019 17:00
Ifurniture stores having a weekend sale and is offering 20% discount on patio chairs and table the sales tax on furniture is 6.25 using function composition how can you represent the total amount a that you would need to pay for this furniture that cost x dollars
Answers: 1
Mathematics, 21.06.2019 17:00
The tuition costs, c, for a local community college are modeled by c(h) = 250 + 200h, where h represents the number of credit hours taken. the local state university has tuition costs, s, modeled by the function s(h) = 300 + 180h. how many credit hours will a student have to take for the two tuition costs to be equal? round the answer to the nearest tenth of an hour.
Answers: 3
You know the right answer?
Which data set is represented by the box plot below? a. 10, 10, 10, 14, 23, 25, 26, 28, 30, 31, 34,...
Questions
Mathematics, 02.07.2019 22:00

Social Studies, 02.07.2019 22:00

History, 02.07.2019 22:00
Mathematics, 02.07.2019 22:00

Mathematics, 02.07.2019 22:00

Biology, 02.07.2019 22:00
Mathematics, 02.07.2019 22:00
Mathematics, 02.07.2019 22:00
Mathematics, 02.07.2019 22:00

Chemistry, 02.07.2019 22:00
Mathematics, 02.07.2019 22:00
Mathematics, 02.07.2019 22:00


