
Mathematics, 20.07.2019 16:50 juliannabartra
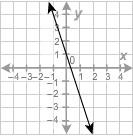
What equation is graphed in this figure? a. y−4=−13(x+2) b. y−3=13(x+1) c. y+2=−3(x−1) d. y−5=3(x−1

Answers: 1


Another question on Mathematics
Mathematics, 21.06.2019 13:30
There are several unique characteristics of qualitative research that make it distinct from quantitative research. describe the aspects of qualitative research and the elements of design that contribute to the rigor of the work. what actions of the researcher can compromise the integrity of the findings?
Answers: 3
Mathematics, 21.06.2019 18:30
Apsychology student wishes to investigate differences in political opinions between business majors and political science majors at her college. she randomly selects 100 students from the 260 business majors and 100 students from the 180 political science majors. does this sampling plan result in a simple random sample? why or why not? no, because each group of 200 students in the sample does not have the same chance of being selected. yes, because each group of 200 students in the sample has the same chance of being selected. no, because each individual student does not have an equal chance of being selected. yes, because each individual student has the same chance of being selected.
Answers: 1
Mathematics, 21.06.2019 19:30
The table below represents the displacement of a fish from its reef as a function of time: time (hours) x displacement from reef (feet) y 0 4 1 64 2 124 3 184 4 244 part a: what is the y-intercept of the function, and what does this tell you about the fish? (4 points) part b: calculate the average rate of change of the function represented by the table between x = 1 to x = 3 hours, and tell what the average rate represents. (4 points) part c: what would be the domain of the function if the fish continued to swim at this rate until it traveled 724 feet from the reef? (2 points)
Answers: 2
Mathematics, 22.06.2019 00:00
Julia bought 7 hats a week later half of all her hats were destroyed in a fire. there are now only 12 hats left with how many did she start
Answers: 1
You know the right answer?
What equation is graphed in this figure? a. y−4=−13(x+2) b. y−3=13(x+1) c. y+2=−3(x−1) d. y−5=3(x−1...
Questions

Computers and Technology, 26.11.2019 04:31


Chemistry, 26.11.2019 04:31
Mathematics, 26.11.2019 04:31

Social Studies, 26.11.2019 04:31


Biology, 26.11.2019 04:31
Mathematics, 26.11.2019 04:31

Geography, 26.11.2019 04:31
Chemistry, 26.11.2019 04:31
Mathematics, 26.11.2019 04:31


