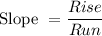
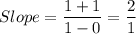
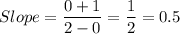
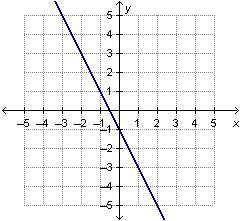
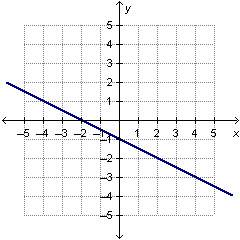
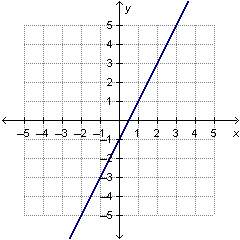
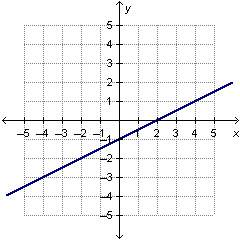
Which graph represents a function with a rate of change of 0.5?
...

Mathematics, 21.01.2020 17:31 marusiaturanova2004
Which graph represents a function with a rate of change of 0.5?

Answers: 3


Another question on Mathematics
Mathematics, 21.06.2019 16:00
Fiona races bmx around a circular dirt course. if the radius of the course is 70 meters, what is the total distance fiona covers in two laps of the race? a. about 30,772 meters b. about 15,386 meters c. about 879.2 meters d. about 439.6 meters e. about 219.8 meters23 points hurry
Answers: 3
Mathematics, 21.06.2019 19:00
The graph shows the charges for a health club in a month. make a function table for the input-output values. writes an equation that can be used to find the total charge y for the number of x classes
Answers: 2
Mathematics, 21.06.2019 19:00
Asap its important using the information in the customer order, determine the length and width of the garden. enter the dimensions.length: feetwidth: feet
Answers: 3
Mathematics, 21.06.2019 22:30
Fast! find the length of cu. the triangles are similar. show your work.
Answers: 2
You know the right answer?
Questions


Mathematics, 21.02.2020 20:50

Computers and Technology, 21.02.2020 20:50
History, 21.02.2020 20:51
Computers and Technology, 21.02.2020 20:51


History, 21.02.2020 20:51
Mathematics, 21.02.2020 20:51


