Mathematics, 27.07.2019 21:00 hasshh
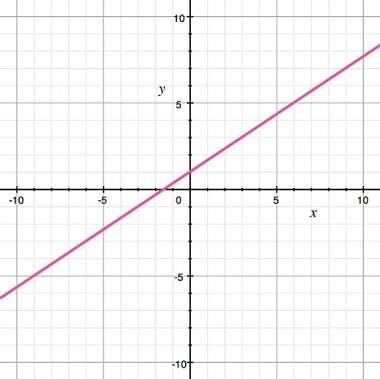
Which of the points listed would fall in the correct shaded area for the inequality? the inequality has been partially graphed in the diagram. y ≤ 2 3 x + 1 a) (0, 2) b) (0, 0) c) (-3, 5) d) (1, 10)


Answers: 2


Another question on Mathematics


Mathematics, 22.06.2019 00:50
Identify the statement below as either descriptive or inferential statistics. upper a certain website sold an average of 117 books per day last week. is the statement an example of descriptive or inferential statistics? a. it is an example of descriptive statistics because it uses a sample to make a claim about a population. b. it is an example of inferential statistics because it uses a sample to make a claim about a population. c. it is an example of inferential statistics because it summarizes the information in a sample. d. it is an example of descriptive statistics because it summarizes the information in a sample.
Answers: 1

Mathematics, 22.06.2019 03:00
What is the slopeof the live that passes through the points and (-2,-5) and (3,-1)
Answers: 2
You know the right answer?
Which of the points listed would fall in the correct shaded area for the inequality? the inequality...
Questions


English, 18.01.2020 05:31


Advanced Placement (AP), 18.01.2020 05:31


Mathematics, 18.01.2020 05:31

Mathematics, 18.01.2020 05:31


English, 18.01.2020 05:31


