
Mathematics, 29.07.2019 00:20 21marmong
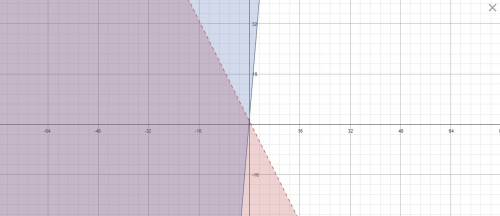
I'll give brainliest and 90 ! what graph represents the system of linear inequalities? 2x+y< 1 y≥12x+2 a) a system of 2 linear inequalities graphed on a coordinate plane. the horizontal x-axis ranges from negative 10 to 10 in increments of 1. the vertical y-axis ranges from negative 10 to 10 in increments of 1. a solid line passes through begin ordered pair negative 4 comma 0 end ordered pair and begin ordered pair negative 0.4 comma 1.8 end ordered pair. a dashed line passing through begin ordered pair negative 2 comma 5 end ordered pair and begin ordered pair negative 0.4 comma 1.8 end ordered pair. the region above the dashed line and above the solid line is shaded. b) a system of 2 linear inequalities graphed on a coordinate plane. the horizontal x-axis ranges from negative 10 to 10 in increments of 1. the vertical y-axis ranges from negative 10 to 10 in increments of 1. a solid line passes through begin ordered pair negative 4 comma 0 end ordered pair and begin ordered pair negative 0.4 comma 1.8 end ordered pair. a dashed line passing through begin ordered pair negative 2 comma 5 end ordered pair and begin ordered pair negative 0.4 comma 1.8 end ordered pair. the region above the dashed line and below the solid line is shaded. c) a system of 2 linear inequalities graphed on a coordinate plane. the horizontal x-axis ranges from negative 10 to 10 in increments of 1. the vertical y-axis ranges from negative 10 to 10 in increments of 1. a solid line passes through begin ordered pair negative 4 comma 0 end ordered pair and begin ordered pair negative 0.4 comma 1.8 end ordered pair. a dashed line passing through begin ordered pair negative 2 comma 5 end ordered pair and begin ordered pair negative 0.4 comma 1.8 end ordered pair. the region below the dashed line and above the solid line is shaded. d) a system of 2 linear inequalities graphed on a coordinate plane. the horizontal x-axis ranges from negative 10 to 10 in increments of 1. the vertical y-axis ranges from negative 10 to 10 in increments of 1. a solid line passes through begin ordered pair negative 4 comma 0 end ordered pair and begin ordered pair negative 0.4 comma 1.8 end ordered pair. a dashed line passing through begin ordered pair negative 2 comma 5 end ordered pair and begin ordered pair negative 0.4 comma 1.8 end ordered pair. the region below the dashed line and below the solid line is shaded.

Answers: 2


Another question on Mathematics
Mathematics, 21.06.2019 22:30
Agallon of apple juice cost $7 a pack of eight 4.23oz box of apple juice $2.39 which is a better deal
Answers: 1
Mathematics, 21.06.2019 23:10
Astudent draws two parabolas on graph paper. both parabolas cross the x-axis at (–4, 0) and (6, 0). the y-intercept of the first parabola is (0, –12). the y-intercept of the second parabola is (0, –24). what is the positive difference between the a values for the two functions that describe the parabolas? write your answer as a decimal rounded to the nearest tenth
Answers: 2
Mathematics, 21.06.2019 23:10
Which graph represents the linear function below? y-4= (4/3)(x-2)
Answers: 2
You know the right answer?
I'll give brainliest and 90 ! what graph represents the system of linear inequalities? 2x+y< 1...
Questions


Mathematics, 18.07.2019 04:30
Mathematics, 18.07.2019 04:30

Arts, 18.07.2019 04:30
Mathematics, 18.07.2019 04:30
Mathematics, 18.07.2019 04:30
Mathematics, 18.07.2019 04:30

Health, 18.07.2019 04:30
Mathematics, 18.07.2019 04:30
English, 18.07.2019 04:30


