
Mathematics, 29.07.2019 02:30 sebasp42
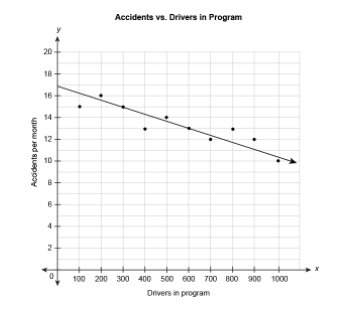
The scatter plot shows the relationship between the number of car accidents in a month and the number of drivers attending a program on distracted driving. the equation represents the linear model for this data. y=−0.0067x+17 what does the number 17 in the equation mean in this context? a)there were no accidents per month when there were 17 drivers in the program. b)the number of accidents decreases by 17 for every 100 drivers in the program. c)for every 100 drivers in the program, there are 17 accidents per month. d)there were 17 drivers in the program when it started. e)there were 17 accidents per month when there were no drivers in the program.

Answers: 1


Another question on Mathematics
Mathematics, 21.06.2019 15:00
The data shown in the table below represents the weight, in pounds, of a little girl, recorded each year on her birthday. age (in years) weight (in pounds) 2 32 6 47 7 51 4 40 5 43 3 38 8 60 1 23 part a: create a scatter plot to represent the data shown above. sketch the line of best fit. label at least three specific points on the graph that the line passes through. also include the correct labels on the x-axis and y-axis. part b: algebraically write the equation of the best fit line in slope-intercept form. include all of your calculations in your final answer. part c: use the equation for the line of best fit to approximate the weight of the little girl at an age of 14 years old.
Answers: 3
Mathematics, 21.06.2019 18:00
Fanny mendelssohn manages all the magazines and paperback books at a local grocery store. she prices many paperbacks to sell at $7.99. the cost to the store is $5.29. what is the markup rate on a paperback book, based on its cost?
Answers: 1
Mathematics, 21.06.2019 23:10
Click an item in the list or group of pictures at the bottom of the problem and, holding the button down, drag it into the correct position in the answer box. release your mouse button when the item is place. if you change your mind, drag the item to the trashcan. click the trashcan to clear all your answers. find the lateral area for the prism. l.a. = 0123456789
Answers: 3
You know the right answer?
The scatter plot shows the relationship between the number of car accidents in a month and the numbe...
Questions
Mathematics, 23.04.2021 01:00
Mathematics, 23.04.2021 01:00

Social Studies, 23.04.2021 01:00
Mathematics, 23.04.2021 01:00
Mathematics, 23.04.2021 01:00


History, 23.04.2021 01:00
Mathematics, 23.04.2021 01:00
Mathematics, 23.04.2021 01:00

English, 23.04.2021 01:00


