Explain your answer!
what equation is graphed in this figure?
y−4=−2/3(x+2)
y+2=...

Mathematics, 22.09.2019 23:30 qholmes02
Explain your answer!
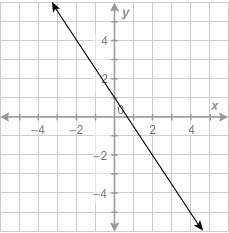
what equation is graphed in this figure?
y−4=−2/3(x+2)
y+2=−3/2(x−2)
y+1=−2/3(x−3)
y−3=3/2(x+1)

Answers: 1


Another question on Mathematics
Mathematics, 21.06.2019 18:00
Suppose you are going to graph the data in the table. minutes temperature (°c) 0 -2 1 1 2 3 3 4 4 5 5 -4 6 2 7 -3 what data should be represented on each axis, and what should the axis increments be? x-axis: minutes in increments of 1; y-axis: temperature in increments of 5 x-axis: temperature in increments of 5; y-axis: minutes in increments of 1 x-axis: minutes in increments of 1; y-axis: temperature in increments of 1 x-axis: temperature in increments of 1; y-axis: minutes in increments of 5
Answers: 2
Mathematics, 21.06.2019 19:00
Tabby sells clothing at a retail store, and she earns a commission of 6.25% on all items she sells. last week she sold a pair of jeans for $32.50, a skirt for $18.95, and 2 blouses for $14.95 each. what was tabby's total commission? a $4.15 b $5.08 c $81.35 d $348.60
Answers: 1
Mathematics, 21.06.2019 20:30
Solve each quadratic equation by factoring and using the zero product property. x^2 + 18x = 9x
Answers: 2
Mathematics, 21.06.2019 21:00
Simplify. 4+3/7x-2-2/7x a. 2-5/7x b. 6-1/7x c. 2+1/7x d. 6+5/7x
Answers: 1
You know the right answer?
Questions
Mathematics, 13.01.2020 05:31


Physics, 13.01.2020 05:31
Mathematics, 13.01.2020 05:31
History, 13.01.2020 05:31

Mathematics, 13.01.2020 05:31
Mathematics, 13.01.2020 05:31
Mathematics, 13.01.2020 05:31
English, 13.01.2020 05:31


