
Mathematics, 10.10.2019 18:30 yuvallevy14
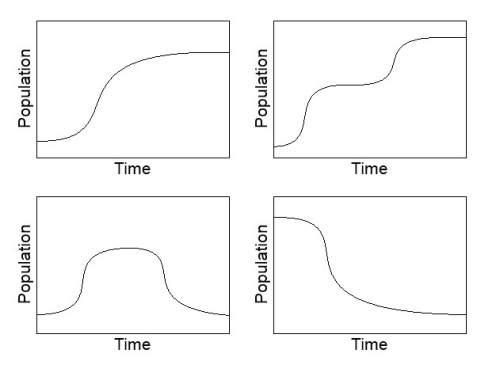
Apopulation of pheasants grew until it reached the maximum carrying capacity of an ecosystem. then, the pheasants' food supply increased. as a result, the carrying capacity of the pheasants' habitat changed.
which graph could represent the history of the pheasant population?
could someone

Answers: 1


Another question on Mathematics
Mathematics, 21.06.2019 19:00
The diagonals of a quadrilaretral intersect at (-1,4). one of the sides of the quadrilateral is bounded by (2,7) and (-3,5) determine the coordinates of the other side in order for the quadrilaretral to be a square.
Answers: 1
Mathematics, 21.06.2019 19:00
Teams of 4 are competing in a 1/4 mile relay race. each runner must run the same exact distance. what is the distance each teammate runs?
Answers: 1
Mathematics, 21.06.2019 19:20
Based on the diagram, match the trigonometric ratios with the corresponding ratios of the sides of the triangle. tiles : cosb sinb tanb sincposs matches: c/b b/a b/c c/a
Answers: 2
You know the right answer?
Apopulation of pheasants grew until it reached the maximum carrying capacity of an ecosystem. then,...
Questions

Chemistry, 06.02.2021 07:50

Mathematics, 06.02.2021 07:50
Chemistry, 06.02.2021 07:50

Mathematics, 06.02.2021 07:50
Mathematics, 06.02.2021 07:50

Arts, 06.02.2021 07:50
Mathematics, 06.02.2021 07:50

Mathematics, 06.02.2021 07:50
Mathematics, 06.02.2021 07:50

World Languages, 06.02.2021 07:50
Mathematics, 06.02.2021 07:50

Health, 06.02.2021 07:50


