
Mathematics, 03.08.2019 20:00 ayoismeisjjjjuan
You research the cost of a gallon of gasoline over several years to look for a trend. the table shows your data. the line of best fit uses years since 1980 as the input value. what is a line of best fit for the data? based upon these prices, how much would you expect to pay in 2030? pls show work year 1980 1984 1988 1992 1996 2000 2004 2008 2012 price per gallon $1.25 $1.27 $1.05 $1.28 $1.43 $1.68 $2.11 $3.72 $3.99

Answers: 1


Another question on Mathematics
Mathematics, 21.06.2019 14:00
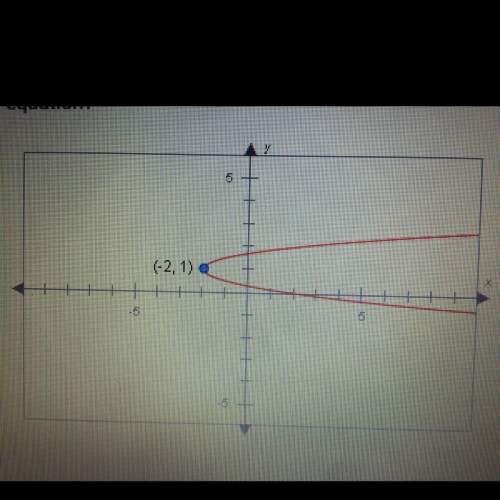
What is the equation of the following graph in vertex form? parabolic function going down from the left through the point zero comma twelve and through the point two comma zero and turning at the point four comma negative four and going up through the point six comma zero and continuing towards infinity courtesy of texas instruments a: y = (x − 4)2 − 4 b: y = (x + 4)2 − 4 c: y = (x + 2)2 + 6 d: y = (x + 2)2 + 12
Answers: 1
Mathematics, 21.06.2019 18:30
Draw a tape diagram to represent each situation.for some of the situations,you need to decide what to represent with a variable andre bakes 9 pans of brownies.he donates 7 pans to the school bake sale and keeps the rest to divide equally among his class of 30 students
Answers: 2
Mathematics, 21.06.2019 19:00
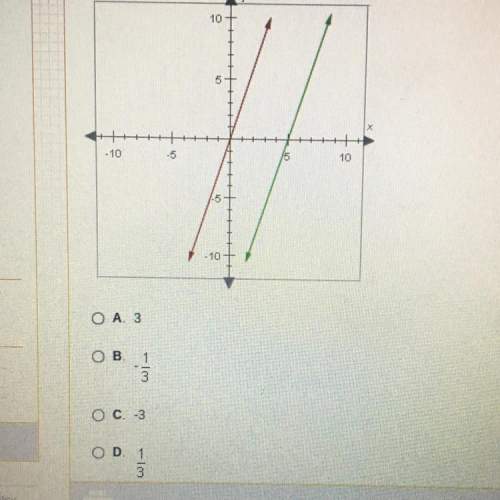
How many solutions does the nonlinear system of equations graphed bellow have?
Answers: 1
Mathematics, 21.06.2019 19:20
The square root of 9x plus 7 plus the square rot of 2x equall to 7
Answers: 1
You know the right answer?
You research the cost of a gallon of gasoline over several years to look for a trend. the table show...
Questions

History, 11.03.2021 22:00


Social Studies, 11.03.2021 22:00
Social Studies, 11.03.2021 22:00


Computers and Technology, 11.03.2021 22:00

Mathematics, 11.03.2021 22:00

Mathematics, 11.03.2021 22:00
Mathematics, 11.03.2021 22:00
Mathematics, 11.03.2021 22:00
English, 11.03.2021 22:00
Mathematics, 11.03.2021 22:00


