
Mathematics, 19.09.2019 19:40 sobell7725
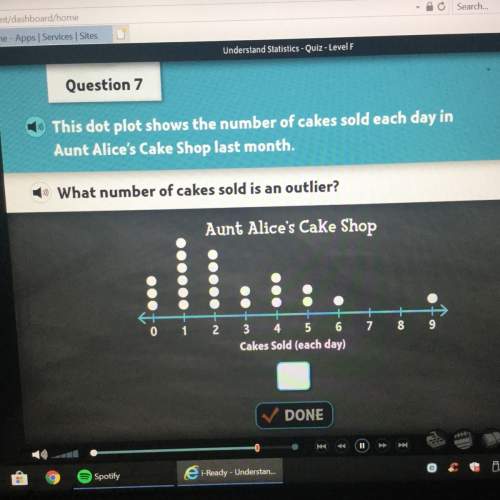
This plot diagram shows the number of cakes sold each day in aunt alice’s cake shop last month. what number of cakes sold is an outlier

Answers: 2


Another question on Mathematics
Mathematics, 21.06.2019 18:30
Alicia puts $400 in a bank account. each year the account earns 5% simple interest. how much money will be in her bank account in six months?
Answers: 1
Mathematics, 21.06.2019 20:10
Gexpressions: practice question 3 of 5 jackson wants to study the popularity of his music video by tracking the number of views the video gets on his website. the expression below represents the total number of views that jackson's video receives n days after he begins tracking the nu views, where b is the rate at which the number of views changes. alb)" select the statement that would accurately describe the effect of tripling a, the initial number of views before jackson beginst the rate at which the number of views changes, b, will triple. the total number of views the video has after n days, a(b)", will not change. the total number of days since jackson begins tracking views, n, will be reduced by one-third. the total number of views the video has after n days, alb)", will triple. submit
Answers: 3
Mathematics, 21.06.2019 21:30
Name and describe the three most important measures of central tendency. choose the correct answer below. a. the mean, sample size, and mode are the most important measures of central tendency. the mean of a data set is the sum of the observations divided by the middle value in its ordered list. the sample size of a data set is the number of observations. the mode of a data set is its highest value in its ordered list. b. the sample size, median, and mode are the most important measures of central tendency. the sample size of a data set is the difference between the highest value and lowest value in its ordered list. the median of a data set is its most frequently occurring value. the mode of a data set is sum of the observations divided by the number of observations. c. the mean, median, and mode are the most important measures of central tendency. the mean of a data set is the product of the observations divided by the number of observations. the median of a data set is the lowest value in its ordered list. the mode of a data set is its least frequently occurring value. d. the mean, median, and mode are the most important measures of central tendency. the mean of a data set is its arithmetic average. the median of a data set is the middle value in its ordered list. the mode of a data set is its most frequently occurring value.
Answers: 3
You know the right answer?
This plot diagram shows the number of cakes sold each day in aunt alice’s cake shop last month. what...
Questions


English, 23.08.2021 03:30

Advanced Placement (AP), 23.08.2021 03:30
English, 23.08.2021 03:30
Mathematics, 23.08.2021 03:30
Mathematics, 23.08.2021 03:30


Biology, 23.08.2021 03:30
Mathematics, 23.08.2021 03:30
Mathematics, 23.08.2021 03:30
Mathematics, 23.08.2021 03:30
Mathematics, 23.08.2021 03:30
Mathematics, 23.08.2021 03:30
English, 23.08.2021 03:30
History, 23.08.2021 03:30


