
Mathematics, 05.02.2020 04:59 kaelycaetano66
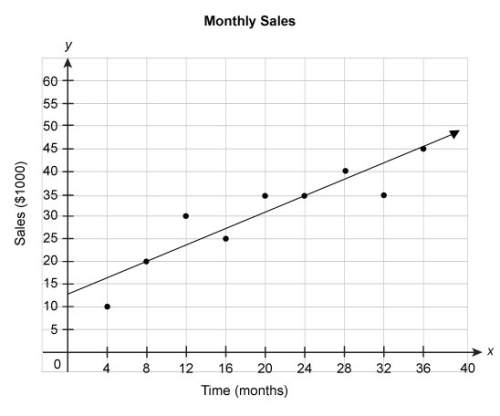
an employee compiled sales data for a company once each month. the scatter plot shows the sales for the company over time. the equation represents the linear model for this data.
y = 0.94x + 12.5
according to the model, what were the company's sales when the employee began collecting data?
a. $5000
b. $12,500
c. $20,000
d. $35,000
e. $45,000

Answers: 3


Another question on Mathematics
Mathematics, 21.06.2019 16:40
One of the inventors of integrated circuits observed that the number of transistors that fit on an integrated circuit will double every 24 months. what type of relationship most appropriately models this situation?
Answers: 3
Mathematics, 21.06.2019 18:00
Darian wants to build a regulation size pool table that is 9 feet in length.he plans he ordered are 18 by 36 inches. what is the scale factor of the dilation he must use to build a regulation pool table
Answers: 1
Mathematics, 21.06.2019 19:40
The weights of broilers (commercially raised chickens) are approximately normally distributed with mean 1387 grams and standard deviation 161 grams. what is the probability that a randomly selected broiler weighs more than 1,425 grams?
Answers: 2
You know the right answer?
an employee compiled sales data for a company once each month. the scatter plot shows the sales for...
Questions

Business, 28.07.2019 16:00


History, 28.07.2019 16:00

History, 28.07.2019 16:00
English, 28.07.2019 16:00


