Mathematics, 03.08.2019 23:30 hardwick744
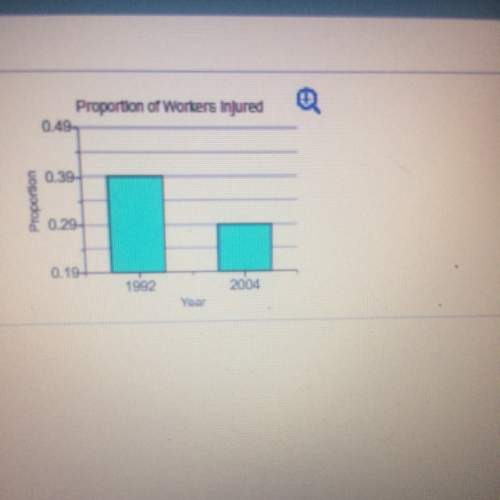
Will get ! the safety manager at bumbler enterprises provides the graph to the right and he claims that the rate of worker injuries has been reduced by 50% over a 12 year period. does the graph support his claim? explain. a. the graph does not support his claim. the vertical scale is different for each bar. b. the graph does not support his claim. the vertical scale does not start at 0 which distorts the percent of change. c. the graph does not support his claim. the vertical tick marks are too far apart to determine the exact value for the proportions. d. the graph supports his claim. the height of the bar for 2004 is less than or equal to 50% of the height of the bar for 1992.


Answers: 2


Another question on Mathematics

Mathematics, 21.06.2019 19:00
Which table represents a linear function? i'll give brainliest to first answer ^'^
Answers: 1

Mathematics, 21.06.2019 23:00
Which of the following scenarios demonstrates an exponential decay
Answers: 1

Mathematics, 21.06.2019 23:30
Savannah had 40 iris blooms last year this year she had 15% more iris blooms how many more hours blooms did savannah have this year
Answers: 1

Mathematics, 21.06.2019 23:30
Dots sells a total of 279 t-shirts ($2) and shorts ($4). in april total sales were $670. how many t-shirts and shorts did dots sell?
Answers: 1
You know the right answer?
Will get ! the safety manager at bumbler enterprises provides the graph to the right and he claims...
Questions


History, 22.06.2019 00:50

Mathematics, 22.06.2019 00:50


Mathematics, 22.06.2019 01:00


Mathematics, 22.06.2019 01:00


