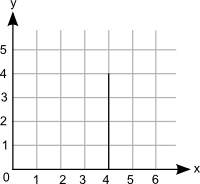
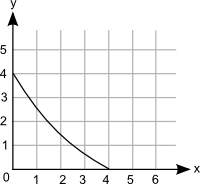
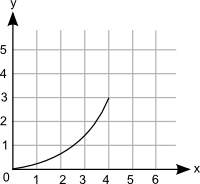
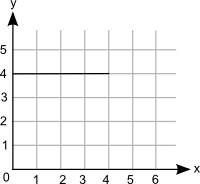
which graph best represents an increasing function?
i know what functions, slope, and all th...

Mathematics, 23.09.2019 16:00 xman839
which graph best represents an increasing function?
i know what functions, slope, and all that is but i thought that a non-linear slope was not a function, so i'm kinda confused plz me fast!

Answers: 1


Another question on Mathematics
Mathematics, 21.06.2019 20:40
Askate shop rents roller skates as shown on the table below. which graph and function models this situation?
Answers: 1
Mathematics, 21.06.2019 21:00
The functions below show the amount of money bella and sweet t had saved after earning money for doing chores. which description best compares the two functions?
Answers: 1
Mathematics, 21.06.2019 22:20
Which of the following equations are equivalent to -2m - 5m - 8 = 3 + (-7) + m? -15m = -4m -7m - 8 = m - 4 -3m - 8 = 4 - m m - 4 = -7m - 8 -8 - 7m = -4 + m -8 - 3m = 4 - m
Answers: 1
Mathematics, 22.06.2019 03:50
Suppose medical records indicate that the length of newborn babies (in inches) is normally distributed with a mean of 20 and a standard deviation of 2.6. find the probability that a given infant is between 14.8 and 25.2 inches long.
Answers: 3
You know the right answer?
Questions


Mathematics, 23.02.2021 22:40

History, 23.02.2021 22:40
Mathematics, 23.02.2021 22:40
English, 23.02.2021 22:40
Mathematics, 23.02.2021 22:40


