
Mathematics, 02.08.2019 21:30 ava108
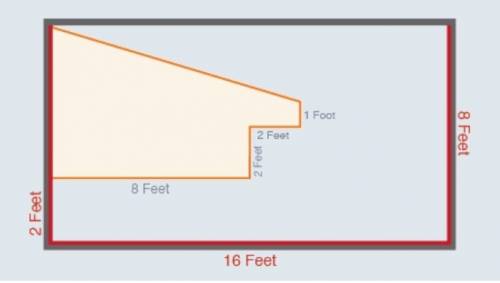
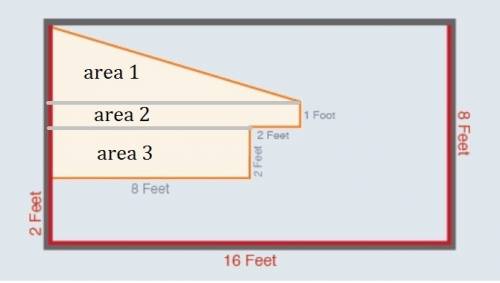
The figure below shows a shaded region and a nonshaded region. angles in the figure that appear to be right angles are right angles. a picture of a rectangle is shown. the bottom of the rectangle is labeled 16 ft. the right side of the rectangle is labeled 8 ft. at the bottom left side of the rectangle there is a label that reads 2 ft. inside the rectangle is a shaded region. the bottom of the region is labeled 8 ft and this side is perpendicular to the left side of the rectangle. the right side of the shaded region has a perpendicular line segment extending upward that is labeled 2 ft. at the top of this line segment is another line segment perpendicular to the right that reads 2 ft. at the end of this line segment is a perpendicular line segment extending upward that reads 1 ft. there is a line segment joining the end of this line segment with the top left corner of the rectangle. what is the area, in square feet, of the shaded region? enter your answer in the box. square feet what is the area, in square feet, of the nonshaded region? enter your answer in the box. square feet

Answers: 1


Another question on Mathematics
Mathematics, 21.06.2019 18:00
Li buys supplies so he can make and sell key chains. he begins to make a profit only after he sells 4 key chains. what point on the graph makes the most sense in this situation?
Answers: 2
Mathematics, 21.06.2019 19:30
Solve the following inequalities and show the solution on a number line. 3/4 (2x-7) ≤ 5
Answers: 1
Mathematics, 21.06.2019 23:00
Unaware that 35% of the 10000 voters in his constituency support him, a politician decides to estimate his political strength. a sample of 200 voters shows that 40% support him. a. what is the population? b. what is the parameter of interest? state its value c. what is the statistics of the interest? state its value d. compare your answers in (b) and (c) is it surprising they are different? if the politician were to sample another 200 voters, which of the two numbers would most likely change? explain
Answers: 2
Mathematics, 22.06.2019 00:20
20 ! need ! which exponential function is represented by the table? f(x) = 0.2(0.5x)f(x) = 0.5(5x)f(x) = 0.5(0.2x)f(x) = 0.2(0.2x)
Answers: 1
You know the right answer?
The figure below shows a shaded region and a nonshaded region. angles in the figure that appear to...
Questions


Social Studies, 19.10.2020 05:01

English, 19.10.2020 05:01

Mathematics, 19.10.2020 05:01

History, 19.10.2020 05:01

Business, 19.10.2020 05:01

Biology, 19.10.2020 05:01
History, 19.10.2020 05:01

Health, 19.10.2020 05:01

Chemistry, 19.10.2020 05:01
Mathematics, 19.10.2020 05:01
English, 19.10.2020 05:01
Mathematics, 19.10.2020 05:01
Mathematics, 19.10.2020 05:01

Mathematics, 19.10.2020 05:01


