
Mathematics, 02.08.2019 07:30 makenziemartinez
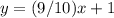
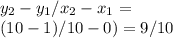
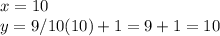
The graph shows the number of cakes sold at karen's cake shoppe for each of their 7 weeks in business: a scatter plot is shown with the title karens cake shoppe. the x axis is labeled weeks in business, and the y axis is labeled cakes sold. the data points are located at 1 and 2, 2 and 4, 3 and 5, 4 and 4, 5 and 6, 6 and 5, and 7 and 8. a line of best fit passes through the y axis at 1 and through the point 10 and 10. if her current pattern continues, how many cakes will karen most likely sell in her 10th week of business? 10, because approximately y = 9 over 10.x + 1 11, because approximately y = 9 over 10.x + 1 8, because approximately y = 1x − 1 12, because approximately y = 1x + 2

Answers: 1


Another question on Mathematics
Mathematics, 21.06.2019 19:30
Select the margin of error that corresponds to the sample mean that corresponds to each population: a population mean of 360, a standard deviation of 4, and a margin of error of 2.5%
Answers: 2
Mathematics, 22.06.2019 03:30
What is the approximate mark up percentage rate before m equals $1740 marked up from p equals $19,422
Answers: 1
Mathematics, 22.06.2019 03:40
What is the value of -3/4 to the 4th power? -256/81 -81/256 81/256 256/81
Answers: 3
Mathematics, 22.06.2019 04:10
Choose the domain & range of the relation shown in the graph: domain: -1, 0, 1, 2, 3 range: -3, -1, 0, 3 domain: -3, -1, 0, 3 range: -3, -1, 0, 3 domain: -3, -1, 0, 3 range: -1, 0, 1, 2, 3 domain: 3, 1, 0, 3 range: -1, 0, 1, 2, 3
Answers: 1
You know the right answer?
The graph shows the number of cakes sold at karen's cake shoppe for each of their 7 weeks in busines...
Questions

Social Studies, 03.12.2020 19:50

Mathematics, 03.12.2020 19:50

Mathematics, 03.12.2020 19:50


Chemistry, 03.12.2020 19:50
Social Studies, 03.12.2020 19:50
Mathematics, 03.12.2020 19:50

History, 03.12.2020 19:50
Mathematics, 03.12.2020 19:50

Biology, 03.12.2020 19:50
Mathematics, 03.12.2020 19:50


