
Mathematics, 01.08.2019 22:00 tyreert1720
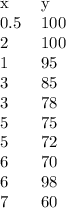
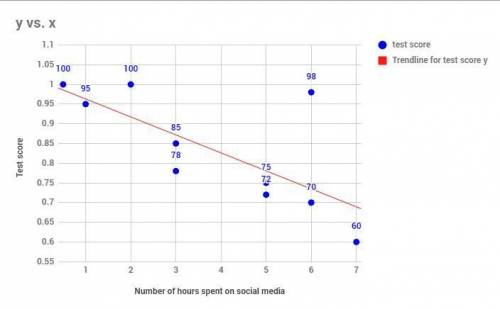
The scatter plot shows the relationship between the test scores of a group of students and the number of hours they spend on social media in a week: a scatter plot is shown. the x-axis is labeled hours spent on social media, and the y-axis is labeled test score. data points are located at 0.5 and 100, 2 and 100, 1 and 95, 3 and 85, 3 and 78, 5 and 75, 5 and 72, 6 and 70, 6 and 98, 7 and 60. a circle labeled a includes all of the points except for the one at 6 and 98. point 6 and 98 is labled b. part a: what is the group of points labeled a called? what is the point labeled b called? give a possible reason for the presence of point b. (3 points) part b: describe the association between a student’s test scores and the number of hours spent on social media. (2 points)

Answers: 1


Another question on Mathematics
Mathematics, 21.06.2019 16:00
Angela rode his bike around a bike trail that was 1/4 of a mile long he rode his bike around the trail 8 * angelo says he wrote a total of 8/4 miles to russell says he's wrong and he actually and says that he actually wrote to my who is corrupt use words and trying to explain how you know.
Answers: 2
Mathematics, 21.06.2019 18:30
If the value of x increases by 5, how does the value of m(x + 3) change? a) it increases by 5m. b) it increases by 8m. c) it decreases by 5m. d) it decreases by 8m.
Answers: 1
Mathematics, 21.06.2019 19:00
Write a function for a rotation 90 degrees counter clockwise about the origin, point 0
Answers: 1
You know the right answer?
The scatter plot shows the relationship between the test scores of a group of students and the numbe...
Questions
Mathematics, 30.03.2020 11:30

English, 30.03.2020 11:30


Health, 30.03.2020 11:30
Mathematics, 30.03.2020 11:30
Mathematics, 30.03.2020 11:30

World Languages, 30.03.2020 11:31

History, 30.03.2020 11:31

Biology, 30.03.2020 11:31
Mathematics, 30.03.2020 11:32

Geography, 30.03.2020 11:32
History, 30.03.2020 11:32
Physics, 30.03.2020 11:33
Mathematics, 30.03.2020 11:33
English, 30.03.2020 11:33
English, 30.03.2020 11:34
Biology, 30.03.2020 11:34
Mathematics, 30.03.2020 11:34


