
Mathematics, 10.10.2019 13:30 jessnolonger
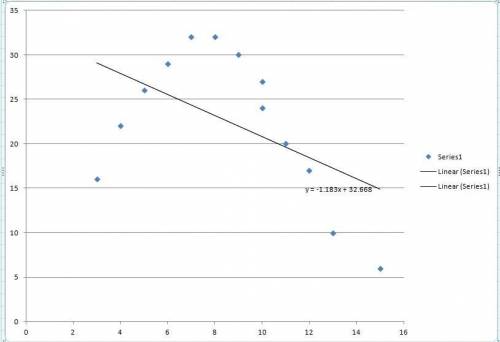
The table shows children’s ages and the number of servings of vegetables the children ate each week.
(a) create a scatter plot of the data.
(b) do the points appear to follow a linear pattern? if so, is the correlation positive or negative?


Answers: 3


Another question on Mathematics
Mathematics, 21.06.2019 17:20
Which functions shave a maximum and are transformed to the left and down of the parent function ,check all that apply f(x) = x2? p(x) =14 (x+7)2 + 1
Answers: 3
Mathematics, 21.06.2019 19:00
Rob spent 25%, percent more time on his research project than he had planned. he spent an extra h hours on the project. which of the following expressions could represent the number of hours rob actually spent on the project? two answers
Answers: 1
Mathematics, 22.06.2019 01:00
Pentagon abcde is dilated according to the rule do,3(x,y) to create the image pentagon a'b'c'd'e', which is shown on the graph. what are the coordinates of point a of the pre-image? a) (-1, 1)b) (-1, 2)c) (-9, 6)d) (-9, 18)
Answers: 3
You know the right answer?
The table shows children’s ages and the number of servings of vegetables the children ate each week....
Questions


Chemistry, 20.07.2019 17:10


Mathematics, 20.07.2019 17:10

Business, 20.07.2019 17:10
Chemistry, 20.07.2019 17:10
Biology, 20.07.2019 17:10

Social Studies, 20.07.2019 17:10
Physics, 20.07.2019 17:10


