Me pl
the scatter plot below shows the number of pizzas sold during weeks when differen...

Mathematics, 26.09.2019 14:30 phillipmccormick
Me pl
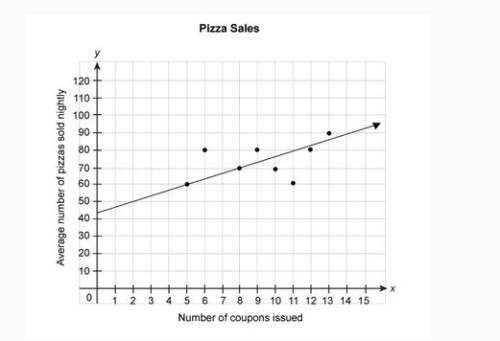
the scatter plot below shows the number of pizzas sold during weeks when different numbers of coupons were issued. the equation represents the linear model for this data. y = 3.4x + 43
according to the model, what is the average number of pizzas sold in one night if no coupons are issued?
question 5 options:
a 43
b 0
c 11
d 21

Answers: 2


Another question on Mathematics
Mathematics, 21.06.2019 17:00
Omar is going on a road trip! the car rental company offers him two types of cars. each car has a fixed price, but he also needs to consider the cost of fuel. the first car costs $90 to rent, and because of its fuel consumption rate, there's an additional cost of s0.50 per kilometer driven.
Answers: 2
Mathematics, 21.06.2019 18:00
What is the measure of angle tvu shown in the diagram below
Answers: 2
Mathematics, 21.06.2019 23:30
The bottom of ignacio's desktop is 74.5cm from the floor. ignacios sits in his adjustable chair, and the tops of his legs are 49.3cm from the floor. each clockwise rotation of the knob on the chair raises ignacio's legs by 4.8cm. write an inequality to determine the number of clockwise rotations, r, ignacio could make with the knob without his legs touching the desk.
Answers: 3
You know the right answer?
Questions
Mathematics, 18.12.2020 23:40
Mathematics, 18.12.2020 23:40
Mathematics, 18.12.2020 23:40


Mathematics, 18.12.2020 23:40

Mathematics, 18.12.2020 23:40
Mathematics, 18.12.2020 23:40

Mathematics, 18.12.2020 23:40

SAT, 18.12.2020 23:40

Chemistry, 18.12.2020 23:40
Physics, 18.12.2020 23:40
Biology, 18.12.2020 23:40

English, 18.12.2020 23:40
Mathematics, 18.12.2020 23:40


