
Mathematics, 30.07.2019 01:00 deannajd03
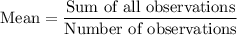
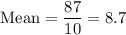
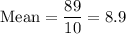
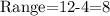
The table shows the number of hours two groups of teens spent on science and math homework last week. each group was made up of 10 teens. 13- to 14-year olds 10 9 11 8 10 10 2 7 8 12 15- to 16-year olds 12 10 8 11 12 12 6 4 4 10 select from the drop-down menus to correctly complete each statement. the mean hours the groups of teens spent studying is , the range for the two groups of of teens is .

Answers: 1


Another question on Mathematics
Mathematics, 21.06.2019 15:00
Find three consecutive numbers such that the sum of one-fourth the first and one-fifth the second is five less than one-seventh the third
Answers: 1
Mathematics, 21.06.2019 16:00
Data are collected to see how many ice-cream cones are sold at a ballpark in a week. day 1 is sunday and day 7 is the following saturday. use the data from the table to create a scatter plot.
Answers: 2
Mathematics, 21.06.2019 18:00
In triangles abc and wxy, a=w and b=x which of the following must be true to prove abc=wxy by the aas theorem? a.ab=bc b.bc=xy c.ab=wx d.
Answers: 1
You know the right answer?
The table shows the number of hours two groups of teens spent on science and math homework last week...
Questions


History, 02.10.2019 09:30
Mathematics, 02.10.2019 09:30

Mathematics, 02.10.2019 09:30
History, 02.10.2019 09:30
Mathematics, 02.10.2019 09:30


