
Mathematics, 29.07.2019 20:30 cdyshaylia55
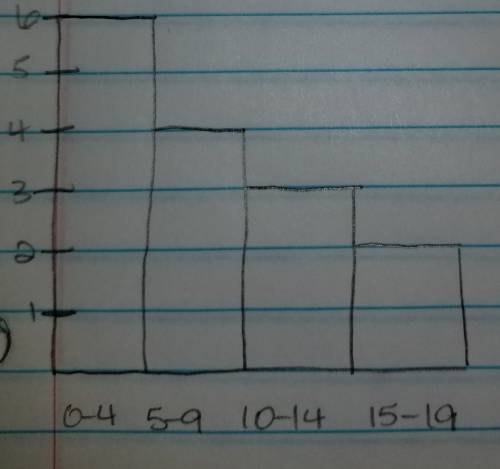
The data below show the number of games won by a football team in each of the last 15 seasons. what is a histogram that represents the data? 3 4 8 12 7 2 1 15 16 6 10 13 4 1 5

Answers: 1


Another question on Mathematics
Mathematics, 21.06.2019 13:30
Write an equation in standard form of the line that passes through the point and has the given slope. ( -2, 4) ; m = -6which of the following best describes the technique used to graph the equation using the slope and y-intercept? y = 5x + 10write the standard form of the equation of the line through the given point with the given slope. point , 4); slope -3/2
Answers: 1
Mathematics, 21.06.2019 18:40
That table shows measurements (in invhes$ from cubes with different side lengths. which pairs of variables have a linear relationship? check all that apply
Answers: 3
Mathematics, 21.06.2019 21:00
Acomposition of transformations maps δxyz to δx"y"z". the first transformation for this composition is , and the second transformation is a 90° rotation about point x'.
Answers: 1
Mathematics, 21.06.2019 21:00
Glenda makes an online purchase for picture frames for $12.95 each and formats of $5.89 each the site says it taxes paid by the customer or 6.5% of the total purchase price shipping charges are based on the
Answers: 1
You know the right answer?
The data below show the number of games won by a football team in each of the last 15 seasons. what...
Questions


Chemistry, 24.05.2021 01:00
Mathematics, 24.05.2021 01:00

Biology, 24.05.2021 01:00


Arts, 24.05.2021 01:00
Mathematics, 24.05.2021 01:00

Mathematics, 24.05.2021 01:00
English, 24.05.2021 01:00


