
Mathematics, 29.07.2019 12:00 liamgreene90
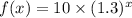
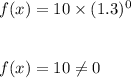
The number of members f(x) in a local swimming club increased by 30% every year over a period of x years. the function below shows the relationship between f(x) and x: f(x) = 10(1.3)x which of the following graphs best represents the function? graph of f of x equals 1.3 multiplied by 10 to the power of x graph of exponential function going up from left to right in quadrant 1 through the point 0, 0 and continuing towards infinity graph of f of x equals 10 multiplied by 1.3 to the power of x graph of f of x equals 1.3 to the power of x

Answers: 1


Another question on Mathematics
Mathematics, 21.06.2019 13:30
What value of x is in the solution set of –5x – 15 > 10 + 20x?
Answers: 1
Mathematics, 21.06.2019 14:20
G(x) = 2 sin(2x - π) + 4. using complete sentences, explain how to find the minimum value for the function.
Answers: 3
Mathematics, 21.06.2019 15:00
Adifferent website gives the cost for the first train as £56.88 and the second train as £20.11 with a £9.50 charge for cycle storage for the whole trip. how much would the journey cost you?
Answers: 2
Mathematics, 21.06.2019 18:30
Astick 2 m long is placed vertically at point b. the top of the stick is in line with the top of a tree as seen from point a, which is 3 m from the stick and 30 m from the tree. how tall is the tree?
Answers: 2
You know the right answer?
The number of members f(x) in a local swimming club increased by 30% every year over a period of x y...
Questions


Mathematics, 29.07.2019 16:10


Computers and Technology, 29.07.2019 16:10

Computers and Technology, 29.07.2019 16:10


