Hi with a few (mean, median) math questions!
1. a student wants to report on the numb...

Mathematics, 16.10.2019 09:30 helper4282
Hi with a few (mean, median) math questions!
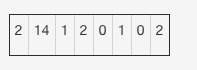
1. a student wants to report on the number of movies her friends watch each week. the collected data are below:
1st pic attachment
which measure of center is most appropriate for this situation and what is its value?
median; 1.5
median; 3
mean; 1.5
mean; 3
2. if the outliers are not included, what is the mean of the data set?
76, 79, 80, 82, 50, 78, 83, 79, 81, 82
77
78
79
80
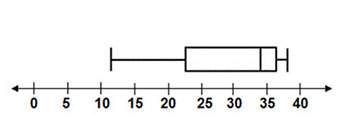
3. given the box plot, will the mean or the median provide a better description of the center?
2nd pic attachement
the mean, because the data distribution is symmetrical
the mean, because the data distribution is skewed to the left
the median, because the data distribution is skewed to the left
the median, because the data distribution is skewed to the right
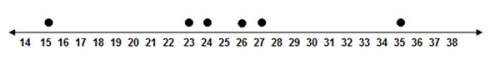
4. when the outliers are removed, how does the mean change?
3rd pic attachement
the mean remains the same.
the mean decreases by 2.
the mean increases by 2.
there are no outliers.

Answers: 1


Another question on Mathematics
Mathematics, 21.06.2019 13:30
Ben wants to play a carnival game that costs $2. in his pocket he has 5 red tickets worth 35 cents each, and 15 blue tickets worth 10 cents each. which of the following systems of inequalities correctly represents the constraints on the variables in this problem? let represent the red tickets and b represent the blue tickets.
Answers: 1
Mathematics, 21.06.2019 15:00
The data shown in the table below represents the weight, in pounds, of a little girl, recorded each year on her birthday. age (in years) weight (in pounds) 2 32 6 47 7 51 4 40 5 43 3 38 8 60 1 23 part a: create a scatter plot to represent the data shown above. sketch the line of best fit. label at least three specific points on the graph that the line passes through. also include the correct labels on the x-axis and y-axis. part b: algebraically write the equation of the best fit line in slope-intercept form. include all of your calculations in your final answer. part c: use the equation for the line of best fit to approximate the weight of the little girl at an age of 14 years old.
Answers: 3
Mathematics, 21.06.2019 15:30
Find the number of positive three-digit even integers whose digits are among 9, 8, 7,5, 3, and 1.
Answers: 2
You know the right answer?
Questions


Biology, 02.02.2020 12:46

Mathematics, 02.02.2020 12:46
Mathematics, 02.02.2020 12:46
Mathematics, 02.02.2020 12:47
Mathematics, 02.02.2020 12:47
English, 02.02.2020 12:47


