
Mathematics, 28.07.2019 03:30 kayvontay4
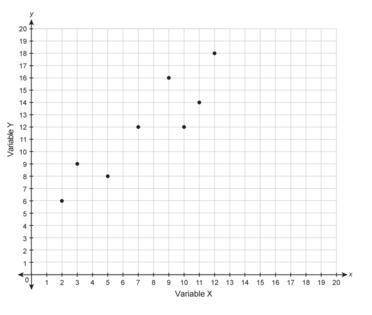
Which equation could represent the relationship shown in the scatter plot? y=23x−7 y = 5x + 1 y=−2x+12 y=78x+6 scatter plot with x axis labeled variable x and y axis labeled variable y. points go from lower left to upper right.

Answers: 1


Another question on Mathematics
Mathematics, 21.06.2019 14:20
Zahra was given two data sets, one without an outlier and one with an outlier. data without an outlier: 15, 19, 22, 26, 29 data with an outlier: 15, 19, 22, 26, 29, 81
Answers: 3
Mathematics, 21.06.2019 23:30
Find measure angle 1 and measure angle 3 in the kite the diagram is not drawn on the scale
Answers: 1
Mathematics, 22.06.2019 02:30
Lines a and b are perpendicular. if the slope of line a is 3, what is the slope of line b?
Answers: 1
You know the right answer?
Which equation could represent the relationship shown in the scatter plot? y=23x−7 y = 5x + 1 y=−2x...
Questions


Mathematics, 27.01.2021 21:50
English, 27.01.2021 21:50
Mathematics, 27.01.2021 21:50
Mathematics, 27.01.2021 21:50

Mathematics, 27.01.2021 21:50

Mathematics, 27.01.2021 21:50
History, 27.01.2021 21:50


