
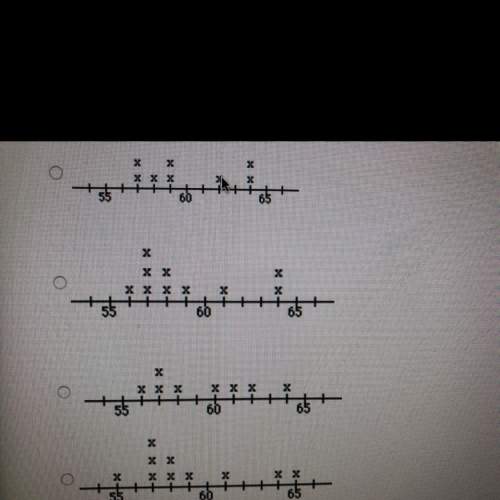
Which line plot matches the set of data? 61, 58, 57, 64, 59, 57, 64, 58, 56, 57.
...

Mathematics, 27.07.2019 22:00 tmontefalcon2424
Which line plot matches the set of data? 61, 58, 57, 64, 59, 57, 64, 58, 56, 57.

Answers: 1


Another question on Mathematics
Mathematics, 21.06.2019 20:00
Ana drinks chocolate milk out of glasses that each holdof a liter. she has of a liter of chocolate milk in her refrigerator. 10 how many glasses of chocolate milk can she pour?
Answers: 2
Mathematics, 21.06.2019 20:30
Suppose you just purchased a digital music player and have put 8 tracks on it. after listening to them you decide that you like 4 of the songs. with the random feature on your player, each of the 8 songs is played once in random order. find the probability that among the first two songs played (a) you like both of them. would this be unusual? (b) you like neither of them. (c) you like exactly one of them. (d) redo () if a song can be replayed before all 8 songs are played.
Answers: 2
Mathematics, 21.06.2019 20:40
Askate shop rents roller skates as shown on the table below. which graph and function models this situation?
Answers: 1
Mathematics, 21.06.2019 21:30
Name and describe the three most important measures of central tendency. choose the correct answer below. a. the mean, sample size, and mode are the most important measures of central tendency. the mean of a data set is the sum of the observations divided by the middle value in its ordered list. the sample size of a data set is the number of observations. the mode of a data set is its highest value in its ordered list. b. the sample size, median, and mode are the most important measures of central tendency. the sample size of a data set is the difference between the highest value and lowest value in its ordered list. the median of a data set is its most frequently occurring value. the mode of a data set is sum of the observations divided by the number of observations. c. the mean, median, and mode are the most important measures of central tendency. the mean of a data set is the product of the observations divided by the number of observations. the median of a data set is the lowest value in its ordered list. the mode of a data set is its least frequently occurring value. d. the mean, median, and mode are the most important measures of central tendency. the mean of a data set is its arithmetic average. the median of a data set is the middle value in its ordered list. the mode of a data set is its most frequently occurring value.
Answers: 3
You know the right answer?
Questions
Mathematics, 13.03.2020 02:23
Mathematics, 13.03.2020 02:23

History, 13.03.2020 02:23

English, 13.03.2020 02:23
Mathematics, 13.03.2020 02:23


Mathematics, 13.03.2020 02:23

Mathematics, 13.03.2020 02:23


