
Mathematics, 12.10.2019 09:50 andrewmena05
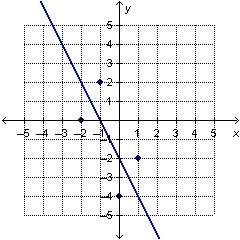
20 the approximate line of best fit for the given data points, y = −2x − 2, is shown on the graph.
which is the residual value when x = –2?
–2
–1
1
2

Answers: 2


Another question on Mathematics
Mathematics, 21.06.2019 15:00
Which statement is always true? a. square bcdf is a rectangle. b. rectangle gjkm is a square. c. quadrilateral stpr is a trapezoid. d. parallelogram abcd is a rhombus.
Answers: 2
Mathematics, 21.06.2019 19:00
Aplot of land has been surveyed for a new housing development with borders ab, bc, dc, and da. the plot of land is a right trapezoid with a height of 60 feet and an opposite leg length of 65 feet
Answers: 1
Mathematics, 21.06.2019 21:30
Consider the following equation. 1/2x^3+x-7=-3sqrtx-1 approximate the solution to the equation using three iterations of successive approximation. use the graph below as a starting point. a. b. c. d.
Answers: 3
Mathematics, 21.06.2019 22:30
Which set of lengths could represent the sides of a triangle? a. 3, 7, 10 b. 4, 5, 10 c. 6, 8, 14 d. 12, 6, 7
Answers: 1
You know the right answer?
20 the approximate line of best fit for the given data points, y = −2x − 2, is shown on the graph.<...
Questions

Mathematics, 29.01.2021 01:20
Mathematics, 29.01.2021 01:20
Mathematics, 29.01.2021 01:20

English, 29.01.2021 01:20

Health, 29.01.2021 01:20

Mathematics, 29.01.2021 01:20
Mathematics, 29.01.2021 01:20

Physics, 29.01.2021 01:20

History, 29.01.2021 01:20


